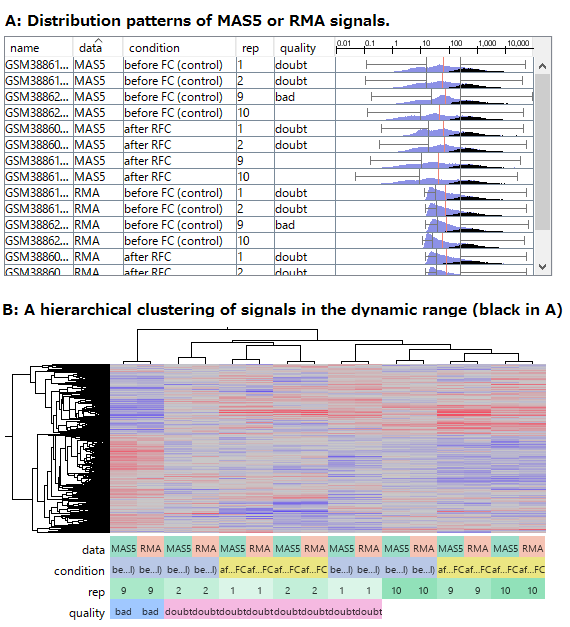
Fig3. Comparing RMA and MAS5 data of abundant genes.
- (A) The distribution patterns of RMA and MAS5 signals. Black indicates signals of abundant genes, which are reliably measured in the dynamic range.
- (B) The result of hierarchical clustering of the abundant genes (Black in A).
You can download the SSA file to import to your Subio Platform.
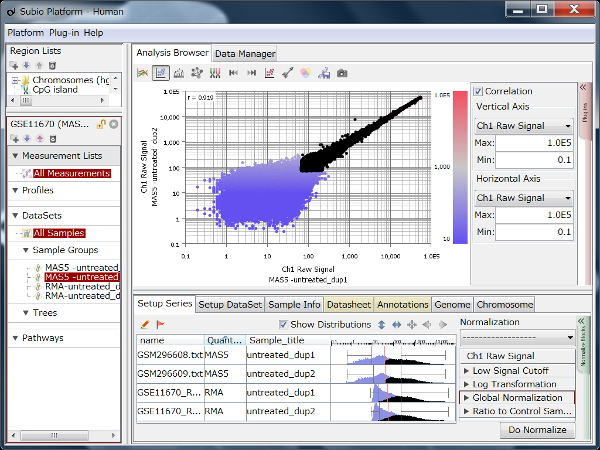
Fig4. MAS5 data of technical replicates on scatter plot and histogram.
GSE11670 is another example of HG-U133 Plus2.0 Array data with technical replicates of good quality. Dots widely scatter at lower left, indicating signals less than 100 are not reliable. Though the histograms of MAS5 look monomodal, but they're intrinsically bimodal. The peak is formed in between signals and noise, because the two components are close and gradual. Signals between 10 and 100 are less reliable, but not absolutely nonsense. You can download the SSA file to import to your Subio Platform.
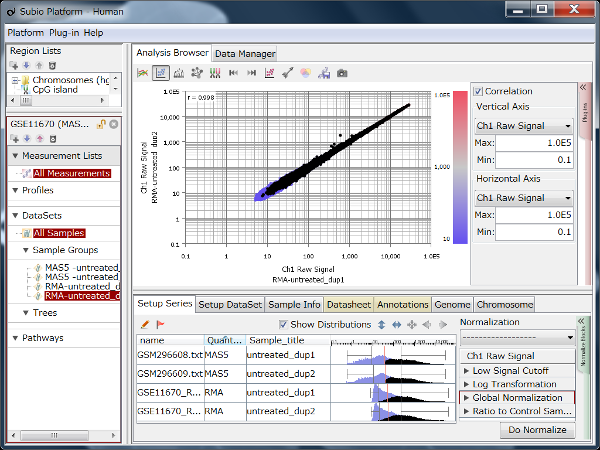
Fig5. RMA data of technical replicates on scatter plot and histogram.
GSE11670 data by RMA. There is no widely scattered area at left-bottom, but it doesn't mean there is no noise and all data are signals. Intrinsic noise must exist in a biological context. If you see histograms (row3 and 4), there are high peak at left side. It only converges low signals into small range. Signals between 10 and 100 are consequently much less reliable, comparing to MAS5 data.
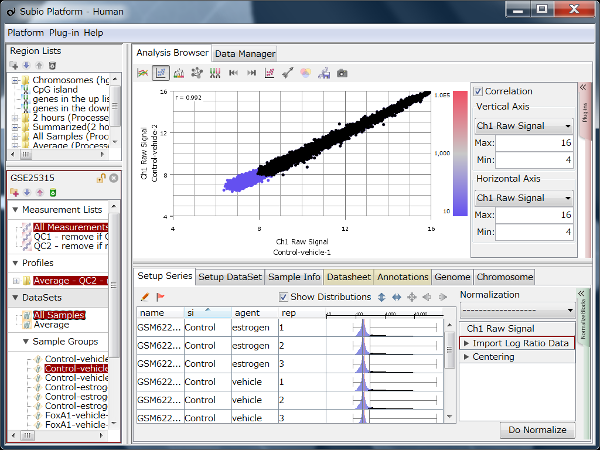
Fig6. Ilumina BeadChip data on scatter plot and histogram.
GSE25315 is obtained with Illumina BeadChip system. It apply RMA as quantification algorithm and that's why it looks highly reproducible on scatter plot. But if you see histogram at the same time, you immediately notice most of data are noise. It makes you realize how important to see histogram. You can download the SSA file to import to your Subio Platform.
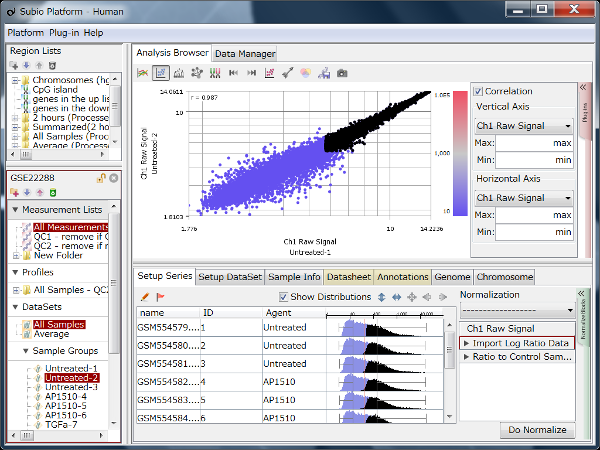
Fig7. Affymetrix Gene ST Array data on scatter plot and histogram.
GSE22288 is obtained with Gene ST Array, which came after 3' IVT Array (HG-U133 Plus 2.0). 3' IVT probes are designed in 3' UTRs because those sequences are more unique than exons. Gene ST probes are targeted exon. It seems the strategy makes data more ambiguous and less sensitive. New technology is not always better than old. It's not rare that matured technology is superior in history. There are tons of 3' IVT GeneChip data available on the web,sThis is another advantage you'd better to consider. You can download the SSA file to import to your Subio Platform.
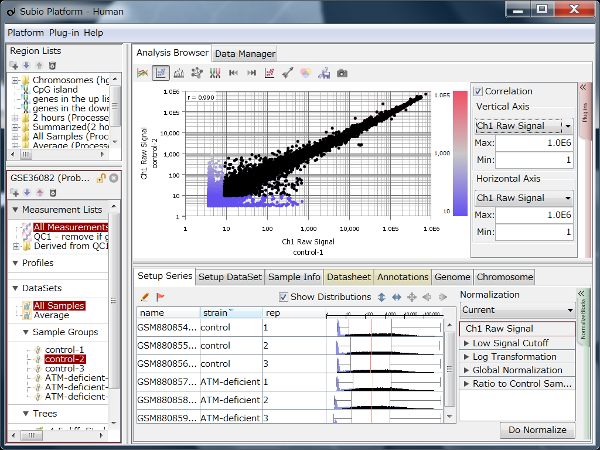
Fig8. Agilent Whole Genome 4x44k data on scatter plot and histogram.
GSE36082 is obtained with Agilent Whole Genome 4x44k microarray, which was a great achievement of microarray technology. And their SurePrint microarrays keep the paramount quality. There is a steep peak at the left end of histogram, which is formed by signals as low as negative control probes. What's good is the edge is brilliantly sharp. It seems you might have a chance to measure slightly expressing genes, or to distinguish not- and lowly-expressing genes. You can download the SSA file to import to your Subio Platform.
Fig9. Scatter plot of Count

Fig10. Scatter plot of TPM
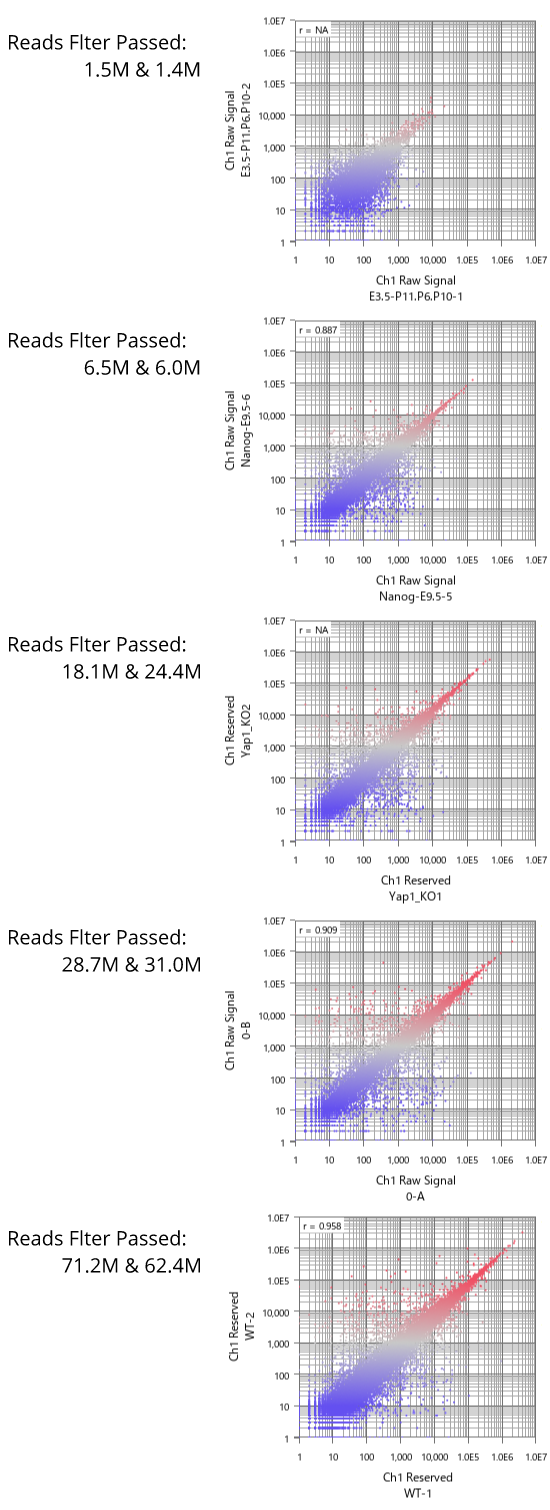
Fig11. The number of reads and the dynamic range of RNA-Seq
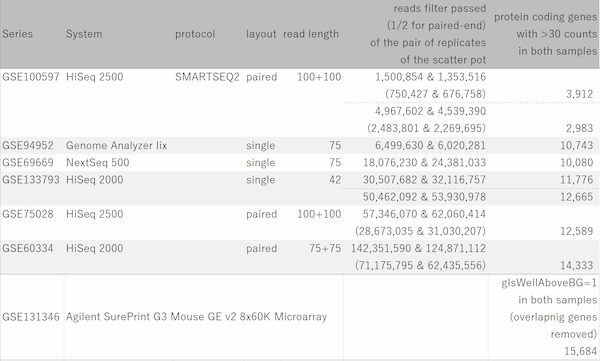
Fig12. The number of reads and the dynamic range of RNA-Seq
- Fig1.
- Fig2.
- Fig3.
- Fig4.
- Fig5.
- Fig6.
- Fig7.
- Fig8.
- Fig9.
- Fig10.
- Fig11.
- Fig12.
The Dynamic Range of RNA-Seq
There are two types of data on expression levels by RNA-Seq. The first is read count (or Count), and the other is TPM, FPKM, and RPKM.
Many commentaries on RNA-Seq data analysis recommend using TPM, FPKM, and RPKM instead of Counts, so we often see the latter in papers and conference presentations. TPM, FPKM, and RPKM are normalized counts per 1 million reads and 1kb length.
However, you need to precisely understand the difference and appropriately choose the right one to analyze.
About Count
Fig9 visualizes Counts from a pair of replicates measured by HiSeq2000. The plots converge diagonally in the region where the count value is higher than 20, suggesting the high reproducibility. However, the dots widely scatter in areas where the count value is lower than 20, indicating the measurements are unreliable. So, this seems to be the noise area in this data (black dots). The dynamic range is not the entire range that all values distributed, but the signal range (colored dots) excluding the noise range.
Here, we use a threshold of 20 for convenience, but in reality, the boundary between the noise and signal ranges are not definite, but a gradient. In this data, we can say that the lower the value becomes less reliable in the region between 10 and 100.
About TPM, FPKM, and RPKM
About normalization per 1kb length
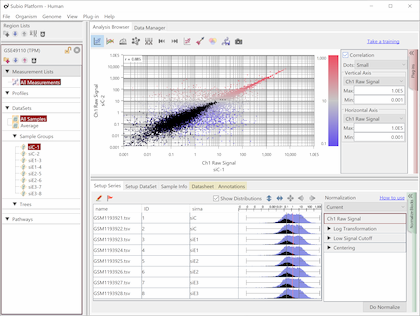
Fig10 shows the same data as Fig9, but the values are TPM. The black dots represent the corresponding genes of noise as Fig9. You see that the noise spreads diagonally and is indistinguishable from the genes in the signal range. However, there is no measurement system having no noise.
The read count is expected to reflect the size of the gene, with larger genes having more Counts and, conversely, smaller genes having fewer Counts. Therefore, it is said that it is better to normalize per 1 kbp of exon length. This claim may seem plausible at first glance, but a consideration reveals that it is not.
Notice that the normalization by length diagonally moves the dots of Fig9. Genes larger than 1kb move in a downward-left direction, and smaller genes shift in an upward-right direction. Consequently, this treatment of data introduces the invisibility of noise. What's more, since the average exon length is much longer than 1 kb, many genes move in a downward-left direction, and the range of values becomes much broader. Many papers have claimed that TPM, FPKM, and RPKM have a wide dynamic range or are sensitive for lowly expressed genes, but this is a false conclusion.
Therefore, you must look at the count, not TPM/FPKM/RPKM, for examining the dynamic range.
By the way, is the claim that "if you don't normalize per 1kb, it is not suitable for expression analysis" true? If your question is which gene is more (or less) expressed in the same sample, you must normalize to the length. However, if you are investigating the change in expression levels between samples, length normalization is not necessary at all. Furthermore, the normalization by length harms the reliability of data analysis.
The Number of Reads and the Dynamic Range of RNA-Seq
The dynamic range of RNA-Seq is, in principle, dependent on the number of reads. If the number of reads is small, most of the reads will be occupied by a small number of superabundant genes. You expect that a massive number of reads would be needed to measure the expression level of a lowly-expressed gene. So let's take a look at how many reads you need for your desired dynamic range using a public database.
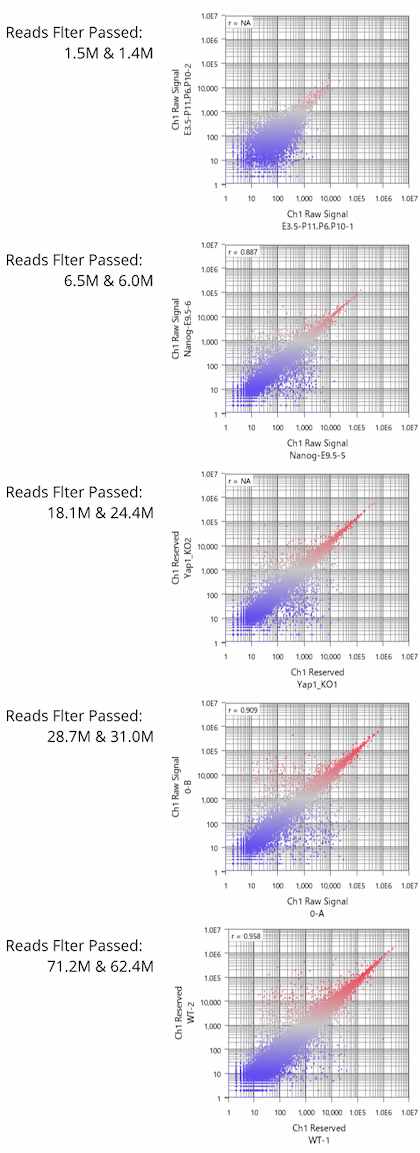

Fig11 shows a scatterplot visualization of the count values from a pair of repeated samples with different numbers of reads from the GEO database. As expected, you can see how the dynamic range expands as the number of leads increases. And here's a little more detailed summary Fig12.
The wider the dynamic range, the more genes will come into the signal range. The number of genes shown in the table is a rough guide to the number of genes in the signal range since the number varies depending on the filtering criterion.
If the number of reads is about 10 million, you will be able to analyze approximately 10,000 genes from the highest expression. However, if you try to extend the dynamic range, you find that the number of reads required increases dramatically.
In addition to the number of reads, the amount of input RNA significantly impacts the dynamic range. The dynamic range of ultra-low-input RNA-Seq and single-cell RNA-Seq data can be exceptionally narrow. The technical improvement is incredible, though, you would better be very careful because there is a much larger variability in the dynamic range among samples than the normal input RNA-Seq.
Also, if you look at many datasets, you will find that there is about a two-fold difference in the number of maximum and minimum reads in most data sets. Data analysis must be adjusted to the narrowest dynamic range by nature. So it is dangerous to rely on the theoretical maximum reads on the sequencer's catalog when estimating the required number of reads. It would be realistic to plan an experiment on the assumption that you are getting samples with a half number of the max reads.
Sequencing only the close to 3' ends doesn't expand the dynamic range theoretically. A paper reports, "We found that the traditional whole transcript method and the 3' RNA-Seq method had similar levels of reproducibility. We found that the 3' RNA-Seq method detected more short transcripts than the whole transcript method." 3' RNA-Seq would be the right choice if you are interested in short transcripts, but it's not a method that you can reduce the number of reads as some ads claims.
Finally, let's talk about UMI, a device to correct the bias in PCR amplification. Deduplication of reads with identical UMIs brings the side effect of reducing the number of reads. We consider it as a trade-off because UMI costs the dynamic range. If the number of reads is more than ten times higher than required, then you will enjoy the positive side of UMI. However, for single-cell RNA-Seq or RNA-Seq from ultra-low-input, the number of reads is far from sufficient. In such cases, adding UMI processing in the pipeline can critically damage data quality.
Please read the following articles, too.