Understanding the Difference Between TPM and FPKM Is Not Enough for RNA-Seq Analysis
TPM and FPKM are commonly used measures of gene expression in RNA-Seq data. Many people search for terms such as “TPM FPKM,” “FPKM vs TPM,” or “how to use TPM for expression analysis.”
TPM and FPKM are both expression measures calculated by adjusting read counts for gene length and sequencing depth. Broadly speaking, FPKM adjusts for gene length while accounting for library size, whereas TPM is calculated so that the total expression value within each sample is scaled to the same level. For this reason, TPM can be easier to interpret when comparing the relative expression levels of different genes within the same sample.
However, what matters in RNA-Seq analysis is not simply whether TPM or FPKM should be used. When differential expression analysis, comparisons between samples, data quality assessment, and interpretation of results are considered together, understanding the difference between TPM and FPKM alone is not sufficient.
For Differential Expression Analysis, Use Gene Counts Instead of TPM or FPKM
In RNA-Seq differential expression analysis, Gene Counts should generally be used as the starting point rather than TPM or FPKM. Common differential expression workflows such as DESeq2, edgeR, and limma-voom are designed to evaluate differences between groups starting from Gene Counts, while accounting for library size and the characteristics of the data distribution.
In contrast, TPM and FPKM are values that have already been adjusted for gene length and sequencing depth. Using these values as the main input for differential expression analysis is inconsistent with the assumptions of standard count-based RNA-Seq analysis methods. If the goal is differential expression analysis, the first step should not be choosing between TPM and FPKM, but obtaining Gene Counts.
This point is explained in more detail in the following article.
TPM, FPKM, and RPKM Should Not Be Used for Differential Expression Analysis | RNA-Seq DEG Analysis Should Start from Gene Counts
Even “Normalized” TPM or FPKM Values Should Not Be Taken at Face Value
What if you are not performing differential expression analysis, but instead using TPM or FPKM values available from a public database or in the supplementary data of a published study to examine overall trends among samples?
Here, it is important to be careful with the word “normalized.” TPM and FPKM are often treated as normalized expression values. They do account for gene length and sequencing depth. However, this does not mean that the resulting data are automatically suitable for reliable comparisons between samples.
TPM and FPKM adjust read counts for gene length and then apply sample-level scaling based on sequencing depth or the sum of length-normalized expression values. These adjustments can account for some differences in overall data scale, but they do not necessarily remove nonlinear distortions often observed in RNA-Seq data, such as between-sample differences that vary across the expression range.
In other words, TPM and FPKM may be easier to work with than raw Gene Counts, but they should not automatically be assumed to provide reliable comparisons between samples. In this article, we use the actual dataset GSE159751 to examine why inspecting the data before analysis remains important, even when the data have already been converted to TPM or FPKM.
Nonlinear Distortions Can Remain Even After Conversion to TPM or FPKM
TPM and FPKM adjust expression values by accounting for factors such as read count, gene length, and sample-level scaling. These adjustments can reduce differences in overall data scale, but they cannot remove all of the complex distortions present in RNA-Seq data.
RNA-Seq data are affected by multiple interacting factors, including RNA quality, sample composition, variability among low-expression genes, and the concentration of reads in particular groups of genes. As a result, differences among samples may appear not only as simple scaling differences, but also as changes in the shape of the overall distribution. Such nonlinear distortions are not resolved simply by converting the data to TPM or FPKM.
In this dataset, the shapes of the FPKM distributions differ substantially among samples. Some samples show distributions that are closer to unimodal, suggesting nonlinear distortions that cannot be addressed by simple scaling alone.
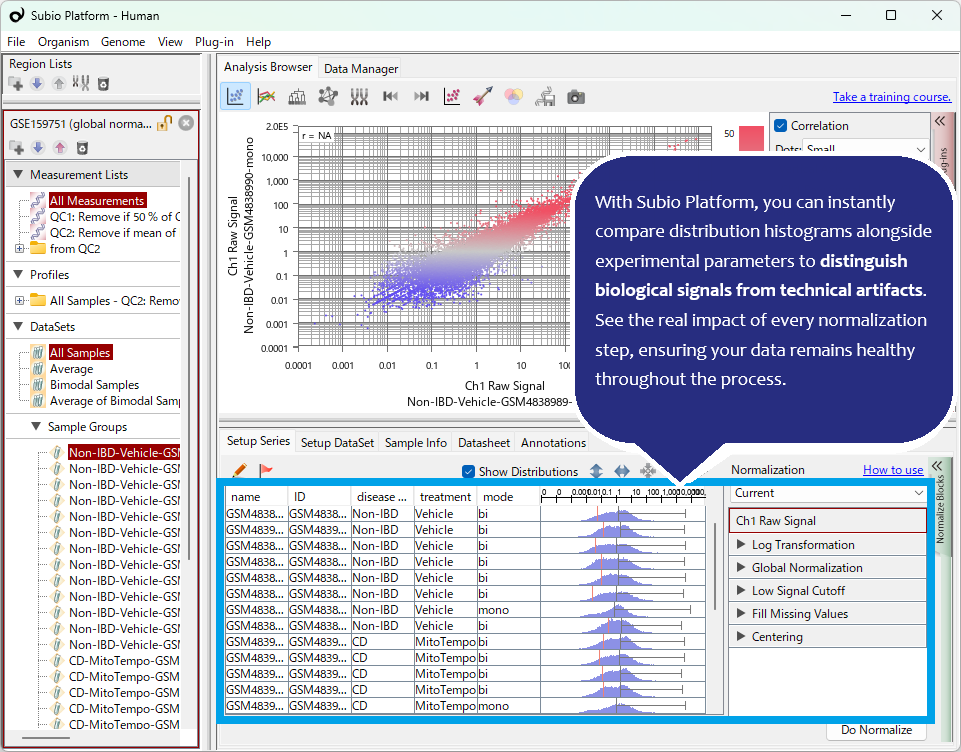
Such differences in distribution can easily be overlooked when TPM or FPKM values are simply provided as processed expression data. However, when the data are properly visualized and examined, samples with questionable quality or distributions that differ substantially from the others can often be identified readily. What matters is that the analyst recognizes that such samples are present, decides how they should be handled, and interprets the analysis results in light of that decision. Analyses that neglect visualization can easily miss this kind of important information.
Additional Normalization or Correction Does Not Always Resolve the Problem
Then, should we simply apply another normalization or correction method to the distortions that remain in TPM or FPKM? In practice, it is not that simple. Even methods such as TMM, VST, ComBat, and Quantile Normalization do not always produce the expected result. Normalization and correction are not magic procedures that mechanically restore data to a biologically appropriate state. Depending on the type and magnitude of distortion in the original data, sample quality, batch structure, and how these factors overlap with group differences, interpretation problems may remain even after correction. Even if the corrected data look cleaner, there is no guarantee that the changes reflect the underlying biological state.
For more details on the limitations of applying TMM, VST, ComBat, Quantile Normalization, and other methods to RNA-Seq data, see the follow-up article Limitations of Batch Effect Correction and Normalization in RNA-Seq.
Quantile Normalization Is Not a Cure-All
In this video, we also apply Quantile Normalization to force the FPKM distributions into the same shape. At first glance, the distributions among samples become much more similar. However, clustering shows that simply aligning the distributions does not resolve the underlying problem. In other words, making the distributions look more uniform does not necessarily make the data suitable for biological comparison.
Work with Distortion in Mind and Develop an Explainable Analysis Strategy
RNA-Seq data frequently contain nonlinear distortions and other differences among samples. Analysis therefore needs to proceed with the possibility of such distortions in mind, while considering how they should be handled.
What matters is neither ignoring the possibility of distortion nor expecting algorithms to remove it completely. You need to understand precisely what changed after applying a given method, and then consider which samples to use, which normalization or correction method to adopt, and how far the observed differences can reasonably be interpreted as biological. RNA-Seq data analysis can be viewed as the process of developing an analysis strategy that can be clearly explained to others while working through this kind of uncertainty.
What Experimental Biologists Should Do Before Relying on Algorithms
Thanks to the efforts of bioinformaticians, many algorithms are now available for addressing highly complex problems. However, regardless of which algorithm is used, it is important to examine the actual data and verify how the method behaves on your own dataset. At present, a more reliable strategy is to prioritize good experimental design and planning for obtaining high-quality raw data and to use Subio Platform to visualize and inspect the state of the data throughout the analysis, rather than relying blindly on “advanced” algorithms.
Once strong systematic errors are introduced into the data, removing their effects and obtaining reliable results may become difficult or even impossible. To reduce the risk of such problems, Subio considers pre-assessment of the measurement technology to be used and experimental planning to reduce risk to be important.
Some problems are difficult to correct after the data have already been generated, so it is important to reduce risk as much as possible at the experimental design stage. Based on our experience analyzing omics datasets with a wide range of problems, Subio also provides support for evaluating measurement technologies and experimental plans before data are generated. [Contact us]
What you need to learn is not simply how to run commands or use tools, but how to analyze data.
Related Topics
- RNA-Seq PCA: When Samples Appear Separated - Check Data Biases Before Assuming Batch Effects
- Limitations of Batch Effect Correction and Normalization in RNA-Seq - Comparing ComBat, VST, TMM, and Quantile Normalization
- What Is RNA-Seq DEG Analysis? - Why P-values, edgeR, and DESeq2 Are Not Enough
- Bulk RNA-Seq Data Analysis Tutorial: Learn the Workflow and How to Interpret Results