About Plug-ins
The plug-in system realizes low cost and flexibility.
Choose smartly whom and how long to use.
License expiration doesn't have your data lost.
You can add analytical tools by activating plug-ins. You can smartly assign plug-ins, not to all, but those who need it and when they need it. Unlike other commercial software, you can still access data generated by Plug-ins even after the license expires.
In a team, most members don't need Plug-in licenses to join discussions or to co-work on the data, but a free Subio Platform. The omics data analysis should not be something done by only specialists, but a challenge for all to bring more biological discoveries and output.
Example workflow using the Basic Plug-in
With the Basic Plug-in, you can perform filtering, PCA, hierarchical clustering, heatmaps, differential expression analysis, Venn diagram comparison, and other analyses directly in Subio Platform.
The following video uses the same dataset as the RNA-Seq Data Analysis Tutorial and shows how to proceed through visualization and comparative analysis using the Basic Plug-in. Before trying the 5-day free trial, you can watch the video to see how the plug-in works in practice.
Subio Platform Basic Plug-in Quick Tutorial: Filtering, PCA, Heatmap, DEG Analysis, and Venn Diagram
See the detailed Basic Plug-in quick tutorial
Check Where Each Plug-in Is Used in the Analysis Workflow
The Basic Plug-in, Advanced Plug-in, and System Plug-in are used for different purposes and analysis steps. To see which plug-in is used at each step of the analysis workflow, please refer to the Omics Data Analysis Guide.
5 Days Free Trial
We provide four types of Plug-ins. You can evaluate all three plug-ins for five days. Please fill the form to request. You will receive Serial Numbers by email, and activate plug-ins with them.
Notice: A PC or Mac is allowed activating a trial only ONE time. You will get errors at second time.
Basic Plug-in US$358/year US$59/30days
Basic Plug-in is a package of fundamental and multi-purpose statistical analysis tools, which you can widely use for gene-expression and other omics data analysis.
Feature List
| Filtering out unreliable measurements for quality control. |
Detail
<p>Filter tool is one of the most important and frequently used tools. It is not only for quality control, but also analyzing.You can filter out genes disturbing statistical analysis, which signals are not reliable at all samples, and which processed signals are unvarying.</p>
<p>Please request a free <a href="/support" title="/support">Online Support</a>, if you don't know how to use this tool.</p>
|
|---|---|
| Extracting statistically differentially expressed genes b/w 2 groups. |
Detail
<p>"Compare to Control" and "Compare 2 Groups" tool are the most frequently used in Basic Plug-in. They extract differentially expressing genes by fold change or statistical test on a volcano plot. You can select one-sample t-test, Student's t-test, Welch's t-test or Mann-Whitney u-test. And you can filter by p-values or BH FDR correct q-values.</p>
<p>Please request a free <a href="/support" title="/support">Online Support</a>, if you don't know how to these tools.</p>
|
| Extracting statistically differentially expressed genes among groups. |
Detail
<p>If there are more than 3 groups, textbooks of statistics says you should apply ANOVA instead t-test, which should be applied when you compare 2 groups. After running ANOVA, you can extract genes by p-values or BH FDR corrected q-values. </p>
<p>If you'd like apply more sophisticated test, you can export the table of Processed Signals from Datasheet tab, and have R or other statistical software analyze it. You can import the measurement list of gene IDs and P-values back to Subio Platform.</p>
<p><span style="background-color: transparent;">Please request a free <a href="/support" title="/support">Online Support</a>, if you don't know how to these tools.</span>
</p>
|
| Run the differential expression analysis b/w 2 groups in bulk. |
Detail
<p>You can extract differentially expressed genes from all combinations of 2 groups comparisons. This is fast and easy when you have a lot of sample groups.</p>
<p>Please request a free <a href="/support" title="/support">Online Support</a>, if you don't know how to use these tools.</p>
|
| Extracting similarly behaving genes from the selected genes. |
Detail
<p>"Find Similar Patterns" tool simply extract genes behaving similarly or oppositely against the selected genes. You can measure similarity by Pearson, uncentered or Spearman correlation.</p>
<p>Please request a free <a href="/support" title="/support">Online Support</a>, if you don't know how to use this tool.</p>
<h3>Changes in new versions.</h3>
<p>It displays a histogram of correlation coefficient, instead of a cumulative curve.</p>
|
| Tree Clustering; overviewing groups of genes with similar patterns. |
Detail
<p>Tree clustering (hierarchical clustering) is useful to group genes by expression patterns.</p>
<p><strong>00:00</strong> Before you apply Tree Clustering, you need to exclude noise, which are</p>
<ol><li>unreliable signals.</li>
<li>unvarying signals.</li>
</ol>
<strong>01:20</strong> Run hierarchical clustering on QC2 list.<p><strong>01:55</strong> The samples are largely divided into normal and tumor group. <br /><span class="Apple-tab-span" style="white-space:pre"> </span>Let's extract genes which are highly expressing in normal and low in tumor.</p>
<p><strong>02:20</strong> The starting level varies among patients, but the trend is downward in tumor.<br /><span class="Apple-tab-span" style="white-space:pre"> </span>If you extract genes sharing a certain pattern, it's reasonable to see their expression levels.</p>
<p><strong>02:50</strong> Apply clustering again, but on "Cluster 1" list.<br /><span class="Apple-tab-span" style="white-space:pre"> </span>No normalization block for making ratio is applied, select "Euclidian" in Similarity Measure.<br /><span class="Apple-tab-span" style="white-space:pre"> </span>Genes sharing a same pattern were divided into some clusters by expression level.</p>
<p><strong>03:55</strong> Run PCA to look the data from another angle.<br /><span class="Apple-tab-span" style="white-space:pre"> </span>PC1 looks reflecting the difference between normal and tumor, and PC2 looks separating the effect of tumor.</p>
<p><strong>04:15</strong> Extract genes contributing to PC2.</p>
<p><strong>04:45</strong> Apply clustering on the list of PC2 contributing.</p>
<p><strong>05:00</strong> Now you see the groups of tumor samples, and their featuring genes.</p>
<p>Please request a free <a href="/support" title="/support">Online Support</a>, if you don't know how to use this tool.</p>
|
| PCA; overviewing how the expression profiles vary among sample groups. |
Detail
<p>Principal component analysis (PCA) visualizes similarity of expression profiles by distances and directions. Closely located plots (samples) share similar expression profiles. If the plots are split over 0 toward positive and negative side, it means they have opposite expression profiles.</p>
<p>Please request a free <a href="/support" title="/support">Online Support</a>, if you don't know how to use this tool.</p>
|
Advanced Plug-in US$358/year US$59/30days
Advanced Plug-in is a package of tools for biological interpretation part, following the part of Basic Plug-ins. GO analysis, pathway analysis, genomic location or sequence analysis are involved.
Feature List
| Finding enriched Gene Ontology (GO) terms or pathways from a gene list. |
Detail
<p>Enrichment Analysis can work on Gene Ontology (GO) categories, canonical pathways, cytobands, miRNAs' target genes, transcription factors' target genes, and so on. <a href="https://david-d.ncifcrf.gov/" title="https://david-d.ncifcrf.gov/" target="_blank">David Functional Annotations</a> is a free web tool and we recommend you use it, and Subio Platform plug-ins have some more useful features.</p>
<p>
Please note that DAVID Functional Annotation has become much easier to use since this video was created.
For a current example of analysis using DAVID,
please also see
<a href="/info_technical/344#section7" title="RNA-Seq Data Analysis Tutorial|7. Gene Annotation and Enrichment Analysis">“7. Gene Annotation and Enrichment Analysis”</a>
in the RNA-Seq tutorial.
</p>
<p>The result table has Redanduncy90 score, which indicates how much redundant the measurement list is. It is the 90th percentile of the number of overlapping measurements against other searching lists. If you want a set of measurement lists which are relatively unique, select lists with the lower Redanduncy90.</p>
|
|---|---|
| Importing pathway images, overlaying expression patterns on them. |
Detail
<p>Pathway Edit Tool enables users creating and modifying graph elements on pathway image. This is designed to be general purposed, and you can import any pathway images. But editing a pathway takes a long time. So we provide "KEGG Pathway Converter" tool so that you can import KEGG pathways with less effort. We can provide converter tools for other pathways, if you need.</p>
<p>Please request a free <a href="/support" title="/support">Online Support</a>, if you don't know how to use this tool.</p>
<h3>Changes in new versions.</h3>
<p>You don't need to download KEGG Pathway Converter. You find it in the install directory of Subio Platform.</p>
|
| Extracting genes correlating to tumor stage, age, dose, etc. |
Detail
<p><strong>Genes Tied in Parameter</strong> tool is extracting genes which are correlated or anti-correlated to numeric parameters, like age, dose, time after treatment, survival time and so on.</p>
<p>Please request a free <a href="/support" title="/support">Online Support</a>, if you don't know how to use this tool.</p>
|
| Extracting genes or probes by relative positions on the genome. |
Detail
<p>"Geomic Location Filter" is extracting genomic elements, like genes, probes or sites, by relative locations. In this movie, we show extracting PHF8 binding sites within 2,000 bp upstream of genes. Reversely, genes having PHF8 binding sites within their 2,000 bp upstream. And finally gene expression probes of such genes.</p>
<p>Please request a free <a href="/support" title="/support">Online Support</a>, if you don't know how to use this tool.</p>
|
| Summarizing and visualizing trends of values along chromosomes. |
Detail
<p><strong>Summarize</strong> tool merges tags or probes per gene or other unit.<br />It's a widely applicable utility in analyzing tiling array, CGH array, ChIP-chip, methylation array, RNA-Seq, ChIP-Seq, Methyl-Seq, etc.</p>
<p>The another way of summarizing is to Create Intervals. When you see dense tags or probes over the genome, neighboring tags may behave similarly. You can merge such neighboring tags or probes to reduce number of measurements. </p>
<p>These tools help your analyzing big data on a computer with small RAM.</p>
<p>Please request a free <a href="/support" title="/support">Online Support</a>, if you don't know how to use this tool.</p>
|
| Getting DNA sequences of specified regions, generating a FASTA file. |
Detail
<p>After extracting genes having certain patterns, you may want to analyze sequences at upstream. Get Sequence tool fetches sequences of relative locations from such genes.</p>
<p>Please request a free <a href="/support" title="/support">Online Support</a>, if you don't know how to use this tool.</p>
|
| Search genomic regions of a specific DNA sequence. |
Detail
<p>Find Regions from Seq searches locations of specified sequences. In this movie, I'm searching regulatory sequence of FOXO1 within upstream of genes, and find candidates controlled by FOXO1.</p>
<p>Please request a free <a href="/support" title="/support">Online Support</a>, if you don't know how to use this tool.</p>
|
| Fill annotation of measurements from the genome. |
Detail
<p>When you analyze data of tiling array, ChIP-chip, CGH array, methylation array, ChIP-Seq, Methyl-Seq or something like that, you often have only locations but gene information. </p>
<p>Annotate Measurements tool brings such information from the currently loaded reference genome track, and it helps your interpreting these data sets in the biological context.</p>
<p>Please request a free <a href="/support" title="/support">Online Support</a>, if you don't know how to use this tool.</p>
|
| Finding pairs of miRNA and target genes showing anti-correlation. |
Detail
<p><strong>Find miRNA Targets</strong> tool is useful if you have a pair of data sets of gene expression and miRNA expression. It calculates correlation coefficients of all pairs miRNA and target gene, which are experimentally validated or computationally predicted. You can see the distribution of the correlation coefficient and extract genes or miRNAs showing anti-correlation.</p>
<p>You can download the SSA files of the <a href="https://static.subioplatform.com/ssa/GSE34679.ssa" title="https://static.subioplatform.com/ssa/GSE34679.ssa">gene expression data set (GSE34679)</a> and <a href="https://static.subioplatform.com/ssa/GSE34680.ssa" title="https://static.subioplatform.com/ssa/GSE34680.ssa">miRNA expression data set (GSE34680)</a> to see on your computer.</p>
<p>Please request a free <a href="/support" title="/support">Online Support</a>, if you don't know how to use this tool.</p>
|
| Searching correlated pairs of genes and genomic elements nearby. |
Detail
<p>Find Correlated Regions tool is useful if you have a pair of ChIP-Seq (ChIP-chip) and gene expression or a pair of DNA methylation and gene expression data sets. You can extract genes which are correlated or anti-correlated to the patterns of DNA binding or modification tags/probes in upstream or overlapping area of the genes.</p>
<p>Please request a free <a href="/support" title="/support">Online Support</a>, if you don't know how to use this tool.</p>
|
| Drawing a scatter plot from different types of omics data. |
Detail
<p>Scatter Plot of Regions allows your directly comparing different types of omics data, only if they're Region Lists. </p>
<p>For example gene expression levels and methylation/binding status in their upstream regions. Or gene expression levels and copy number status around the genes. </p>
<p>Please request a free <a href="/support" title="/support">Online Support</a>, if you don't know how to use this tool.</p>
|
| Drawing Kaplan-Meier survival curve of groups from omics profiling. |
Detail
<p>This tutorial shows how to prepare for drawing Kaplan-Meier Survival Curve.</p>
<p>This tool has often been applied to test survival rates of treated and non-treated groups. But with Subio Platform and stored data sets, you can easily test survival rates of grouped patients by gene expression levels of a specific genes, or by methylation levels of tumor suppressor genes.</p>
<p>Please request a free <a href="/support" title="/support">Online Support</a>, if you don’t know how to do it exactly.</p>
|
System Plug-in US$358/year US$59/30days
System Plug-in is an essential expansion for those who are doing prospective studies, who are storing lots of datasets to use them as the reference, and who are challenging integrative multi-omics data analysis.
Feature List
| Importing MSigDB / Finding Measurement Lists or Pathways by keywords. |
Detail
<p><span style="background-color: transparent;">The Molecular Signatures Database (MSigDB) is a collection of annotated gene sets for use with GSEA software. The MSigDB gene sets are divided into eight major collections;</span>
</p>
<ul><li>Hall mark<span style="background-color: transparent;"> gene sets, representing well-defined biological states or processes.</span>
</li>
<li>Positional gene sets, representing chromosome and cytoband.</li>
<li>Curated gene sets, representing online pathways, publications in PubMed, and knowledge of domain experts.</li>
<li>Motif gene sets, representing conserved cis-regulatory motifs of transcription factors and miRNAs.</li>
<li>Computational gene sets defined by mining large collections of cancer-oriented microarray data.</li>
<li>GO gene sets, representing gene annotation of gene ontology terms.</li>
<li>Oncogenic gene sets defined directly from microarray gene expression data from cancer gene perturbations.</li>
<li>Immunologic gene sets defined directly from microarray gene expression data from immunologic studies.</li>
</ul>
<p>Learn more at <a href="https://software.broadinstitute.org/gsea/msigdb" title="https://software.broadinstitute.org/gsea/msigdb">https://software.broadinstitute.org/gsea/msigdb</a>
</p>
<p>You can make use of the gene sets by importing as measurement lists. After that, you can execute the powerful enrichment analysis on them.</p>
<p>"Find Measurement Lists or Pathways tool" is useful to find them from the name or contents gene.</p>
<p>The result table has Redanduncy90 score, which indicates how much redundant the measurement list is. It is the 90th percentile of the number of overlapping measurements against other searching lists. If you want a set of measurement lists which are relatively unique, select lists with the lower Redanduncy90.</p>
|
|---|---|
| Overviewing a lot of multi-omics data sets in your Subio Platform. |
Detail
<p>When dealing with a vast number of Series spanning multiple Platforms and Organisms, opening and inspecting each one individually becomes an overwhelming task. The <strong>Scan Genes Over Series</strong> tool solves this by providing a bird's-eye perspective.</p>
<p>In essence, it allows you to perform searches on your local Subio Platform data similar to the <a href="https://www.ncbi.nlm.nih.gov/geoprofiles/" title="https://www.ncbi.nlm.nih.gov/geoprofiles/" target="_blank">NCBI GEO Profiles tool.</a> The key advantage is that you can search for and compare two genes simultaneously. This tool helps you quickly answer questions such as:</p>
<ul><li>In which Series is the expression of these genes exceptionally high?</li>
<li>Which Series show significant fluctuations in these genes?</li>
<li>•In which Series do these two genes exhibit highly similar expression patterns?</li>
</ul>
<h3>Important Tips for Effective Use</h3>
<ul><li><strong>Vertical Axis & Data Type: </strong>
<br />The graph's vertical axis represents the Ch1 Raw Signal. To ensure consistent and meaningful results, ensure that you import and store values as close to the<strong> raw data</strong> as possible (e.g., <a href="/products/subioplatform/mas5-vs-rma" title="/products/subioplatform/mas5-vs-rma">MAS5 rather than RMA</a> for <a href="/products/subioplatform/the-dynamic-range-of-rna-seq" title="/products/subioplatform/gene-counts-vs-FPKM-or-TPM">GeneChip or Gene Counts rather than FPKM/TPM</a> for RNA-Seq).</li>
<li><strong>Search by Gene Symbol: </strong>
<br />The tool searches using Gene Symbols. Since Feature IDs are often Probe IDs or ENSEMBL IDs, ensure you use the Select Symbol Column button in the Platform list toolbar to designate the correct column.</li>
<li><strong>DataSet Organization: </strong>
<br />The tool displays the topmost DataSet in the list. For the best results across all Series, we recommend placing an "All Samples" DataSet at the top of the DataSets section. This DataSet should:</li>
</ul>
<ol><li><strong>Display individual samples</strong> (no averaging/grouping).</li>
<li><strong>Show all parameters</strong> necessary to get a complete overview of the Series.</li>
</ol>
<ul><li><strong>Database Preparation: </strong>
<br />Generating the search database is a heavy process. It won't be ready for immediate use the first time you initiate it. We suggest starting the database construction before leaving for the day or during a break so it is ready when you need it.</li>
</ul>
<p>If you have any questions regarding the operation of this tool, please feel free to apply for our free online support.</p>
|
| Drawing a TSS Plot with various statistics. |
Detail
<p>TSS Plot tool draws several types of charts visualizing the distribution of values according to the relative distance from TSS.</p>
<p>Classically, it draws the count of events of transcription factors' binding or DNA/histone modifications in the histogram. Moreover, Subio Platform’s TSS Plot can visualize the percentage of methylation. Hyper- or hypo-methylation against the control, the correlation coefficient between gene expression and methylation patterns, and so on.</p>
|
| Copying a series. Modifying samples of a series. |
Detail
<p>If you have a lot of samples and series, these utility tools are extremely useful.</p>
<p><strong>Make A Copy of This Series</strong> tool is simple, but necessary before changing the series safely.</p>
<p><strong>Add/Remove Samples</strong> can remove bad quality samples from the series. Or it can add new samples to series, and this is essential for prospective studies.</p>
<p>Please request a free <a href="/support" title="/support">Online Support</a>, if you don't know how to use these tools.</p>
|
| Preparing for analyzing multi-omics data sets over multiple platforms. |
Detail
<p>To integrate multi-omics datasets, this tool finds common samples in different platforms and mark them. This is a utility tool for easing the preparation, and the analysis is done with "<a href="/info_technical/153" title="/info_technical/153">Find miRNA Targets</a>" or "<a href="/info_technical/159" title="/info_technical/159">Find Correlated Regions</a>" tool.</p>
|
| Converting measurements to regions. Filtering regions. |
Detail
<p>Because Measurement Lists and DataSets get inaccessible after you load another Series. You can convert information as Region Lists to bridge in multi-omics studies. <br />And this is essential to use other tools of Advanced Plug-in because they often takes Region Lists as input.</p>
<p>Please request a free <a href="/support" title="/support">Online Support</a>, if you don't know how to use these tools.</p>
<h3>Changes in new versions.</h3>
<p>Region Score Filter displays histogram of the values to filter, so that you can easily determine the threshold.</p>
|
| Importing a gene list, or a set of lists, from external files. |
Detail
<p>You can import a gene list or a set of lists from external text files to see the expression patterns of those genes in Subio Platform. Importing gene lists also make them in use for <a href="/info_technical/152" title="/info_technical/152">enrichment analysis</a>.</p>
<p>Gene IDs can be anything only if the platform has the IDs. You can import gene lists with some statistics or numbers use them for filtering with Subio Platform. So you can work with R or other statistical tools for calculations, and bring the results to integrate with biologically meaningful views.</p>
|
Variation Plug-in US$358/year US$59/30days
Variation Plug-in is a package of tools for detecting SNPs and indels from the FASTQ file, for annotating variants, and aggregating variants so that you can quickly extract candidates.
Feature List
| Detecting Genomic Variations (SNPs and indels) from the RNA-Seq FASTQ files. |
Detail
<p>The pipeline is created as referring to <a href="https://gatk.broadinstitute.org/hc/en-us/articles/360035531192-RNAseq-short-variant-discovery-SNPs-Indels-" title="https://gatk.broadinstitute.org/hc/en-us/articles/360035531192-RNAseq-short-variant-discovery-SNPs-Indels-" target="_blank">GATK's RNAseq short variant discovery (SNPs + Indels)</a>. Please be noticed that we deploy HISAT2 for alignment instead of STAR to save memory consumption. Please be noticed that it won't work with any other organisms but human.</p>
<p>Please setup the pipeline to run GATK on the RNA-Seq data.</p>
<ul><li><a href="/info_technical/359" title="/info_technical/359">The pipeline setup guide for Windows users</a>
</li>
<li><a href="/info_technical/358" title="/info_technical/358">The pipeline setup guide for Mac users</a>
</li>
</ul>
|
|---|---|
| Predicting the effect of detected SNPs or indels. |
Detail
<p><a href="https://snpeff.sourceforge.net/" title="https://snpeff.sourceforge.net/" target="_blank" id="wym-1589357179465">SnpEff is a variant annotation and effect prediction tool.</a> The Annotate VCF tool utilizes this program from Subio Platform's GUI. You have to use this tool before using aggregation tools. They say it accepts both .vcf and .vcf.gz files, but it may work fine only with .vcf files. So I recommend you uncompress the .gz files.</p>
<p>if you don't find a database which is suitable for your data, <a href="https://snpeff.sourceforge.net/SnpEff_manual.html#databases" title="https://snpeff.sourceforge.net/SnpEff_manual.html#databases" target="_blank">please build it by yourself</a>.</p>
|
| Comparing mutations between the control and case groups for filtering. |
Detail
<p>This tool accepts annotated VCF files. So run the Annotate VCF tool first.</p>
<p>The input VCF files might be of two groups, which are case and control. This tool aggregates variations so that you can easily extract candidates of target by enabling filtering mutation type or the frequency in the control or case groups.</p>
<p>There are two modes of execution. The “Count by Variant” mode aggregates each variation. On the other hand, the “Count by Location” mode ignores what kind of mutation occurs, but minds only location.</p>
|
| Comparing mutations per gene between the control and case groups for filtering. |
Detail
<p>This tool accepts annotated VCF files. So run the Annotate VCF tool first.</p>
<p>The input VCF files might be of two groups, which are case and control. This tool aggregates variations per gene so that you can easily extract candidates of the target gene by enabling filtering mutation type or the frequency in the control or case groups.</p>
|
| Summarizing mutations of a target gene per exon. Extracting variants on specified exons. |
Detail
<p>This tool is useful after the analysis with the Aggregate Variants or the Aggregate Variants per Gene tool. <br />After you got a list of candidates of the target gene, this tool allows you to summarize per exon for each candidate.</p>
<p><span style="background-color: transparent;">And the Filter by Exon tool extracts genomic elements on specified exons of a transcript.</span>
</p>
|
Price List
Plug-in
| 1 Year License | 30 Days License | |
|---|---|---|
| Basic Plug-in | 358 USD | 59 USD |
| Advanced Plug-in | 358 USD | 59 USD |
| System Plug-in | 358 USD | 59 USD |
| Variation Plug-in | 358 USD | 59 USD |
| 1 Year License | 30 Days License | |
|---|---|---|
| Basic Plug-in | 358 EUR | 59 EUR |
| Advanced Plug-in | 358 EUR | 59 EUR |
| System Plug-in | 358 EUR | 59 EUR |
| Variation Plug-in | 358 EUR | 59 EUR |
| 1 Year License | 30 Days License | |
|---|---|---|
| Basic Plug-in | 50,800 JPY | 8,500 JPY |
| Advanced Plug-in | 50,800 JPY | 8,500 JPY |
| System Plug-in | 50,800 JPY | 8,500 JPY |
| Variation Plug-in | 50,800 JPY | 8,500 JPY |
1 Year License
-
Basic Plug-in
358 USD -
Advanced Plug-in
358 USD -
System Plug-in
358 USD -
Variation Plug-in
358 USD
30 Days License
-
Basic Plug-in
59 USD -
Advanced Plug-in
59 USD -
System Plug-in
59 USD -
Variation Plug-in
59 USD
1 Year License
-
Basic Plug-in
358 EUR -
Advanced Plug-in
358 EUR -
System Plug-in
358 EUR -
Variation Plug-in
358 EUR
30 Days License
-
Basic Plug-in
59 EUR -
Advanced Plug-in
59 EUR -
System Plug-in
59 EUR -
Variation Plug-in
59 EUR
1 Year License
-
Basic Plug-in
50,800 JPY -
Advanced Plug-in
50,800 JPY -
System Plug-in
50,800 JPY -
Variation Plug-in
50,800 JPY
30 Days License
-
Basic Plug-in
8,500 JPY -
Advanced Plug-in
8,500 JPY -
System Plug-in
8,500 JPY -
Variation Plug-in
8,500 JPY
Plug-in Set
| 1 Year License | |
|---|---|
| Plug-in Set of 2 Types |
548 USD
|
| Plug-in Set of 3 Types |
728 USD
|
| Plug-in Set of 4 Types |
898 USD
|
- Plug-in Set users can order Data Analysis Service and Online Training with a 40% discount for one year from the purchase date.
-
You can take advantage of various discount programs that allow you to receive up to 50% OFF on Plug-ins.
For details, please see:
Discount Programs Overview
| 1 Year License | |
|---|---|
| Plug-in Set of 2 Types |
548 EUR
|
| Plug-in Set of 3 Types |
728 EUR
|
| Plug-in Set of 4 Types |
898 EUR
|
- Plug-in Set users can order Data Analysis Service and Online Training with a 40% discount for one year from the purchase date.
-
You can take advantage of various discount programs that allow you to receive up to 50% OFF on Plug-ins.
For details, please see:
Discount Programs Overview
| 1 Year License | |
|---|---|
| Plug-in Set of 2 Types |
76,800 JPY
|
| Plug-in Set of 3 Types |
101,800 JPY
|
| Plug-in Set of 4 Types |
125,800 JPY
|
- Plug-in Set users can order Data Analysis Service and Online Training with a 40% discount for one year from the purchase date.
-
You can take advantage of various discount programs that allow you to receive up to 50% OFF on Plug-ins.
For details, please see:
Discount Programs Overview
-
Plug-in Set of 2 Types
716 USD548 USD -
Plug-in Set of 3 Types
1,074 USD728 USD -
Plug-in Set of 4 Types
1,432 USD898 USD
Plug-in Set users can order Data Analysis Service and Online Training with a 40% discount for one year from the purchase date.
You can take advantage of various discount programs that allow you to receive up to 50% OFF on Plug-ins.
For details, please see:
Discount Programs Overview
-
Plug-in Set of 2 Types
716 EUR548 EUR -
Plug-in Set of 3 Types
1,074 EUR728 EUR -
Plug-in Set of 4 Types
1,432 EUR898 EUR
Plug-in Set users can order Data Analysis Service and Online Training with a 40% discount for one year from the purchase date.
You can take advantage of various discount programs that allow you to receive up to 50% OFF on Plug-ins.
For details, please see:
Discount Programs Overview
-
Plug-in Set of 2 Types
101,600 JPY76,800 JPY -
Plug-in Set of 3 Types
152,400 JPY101,800 JPY -
Plug-in Set of 4 Types
203,200 JPY125,800 JPY
Plug-in Set users can order Data Analysis Service and Online Training with a 40% discount for one year from the purchase date.
You can take advantage of various discount programs that allow you to receive up to 50% OFF on Plug-ins.
For details, please see:
Discount Programs Overview
Order Form
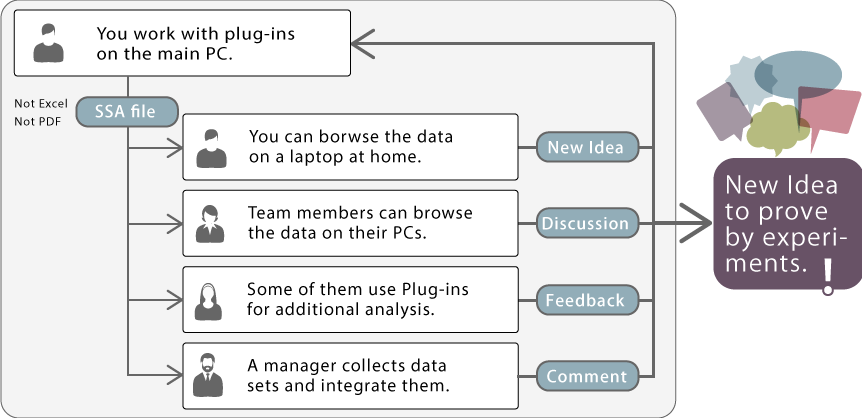
Why Plug-in System?
Though a valid license is needed when you use the plug-in, you don't need licenses to browse the results which are saved in Subio Platform. In other words, you don't need to buy licenses for every computer to browse data. This puts Subio Platform in a unique position.
You can share data via SSA files including analysis results generated with a plug-in among free Subio Platforms on any computers of team members. We believe this is the easiest and most reasonable way to work on omics data to maximize the opportunity of discovering by team. Because nobody can extract all meanings by themselves, we think it's important to tackle the difficult task by a team. Subio Platform's plug-in system embodies a cooperative working environment.
 People and balloons are designed by Freepik.