Technologies for measuring gene expression levels reached the current maturity at least before 2004. So data sets generated by skillful researchers are reliable. On the other hand, measuring miRNAs seems to be still difficult. You would better to know that miRNA expression data sets are not as reliable as gene expression's. Here I am showing several data sets of genes' and miRNAs' expression comparing normal and hepatocellular carcinoma (HCC.)
Gene Expression Data Sets
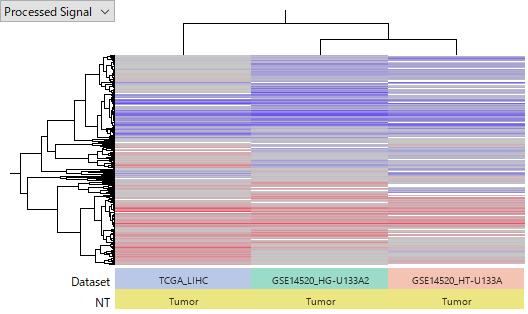
The following heatmap represents 2 data sets, TCGA-LIHC and GSE14520 . TCGA's gene expression data is based on RNA-Seq. GSE14520 is measured by two GeneChips, Affymetrix HG-U133A 2.0 Array and HT_HG-U133A Array. Consequently, there are three data sets in total. Raw data are normalized and pre-processed in each data set to represent averaged log2 ratio of tumor against normal samples. Red (or blue) color indicates over- (or under-) expressing in tumor.
It is remarkable that the detection of over- or under- expression genes are roughly consistent among the three, even if they are measured by fundamentally different technologies.
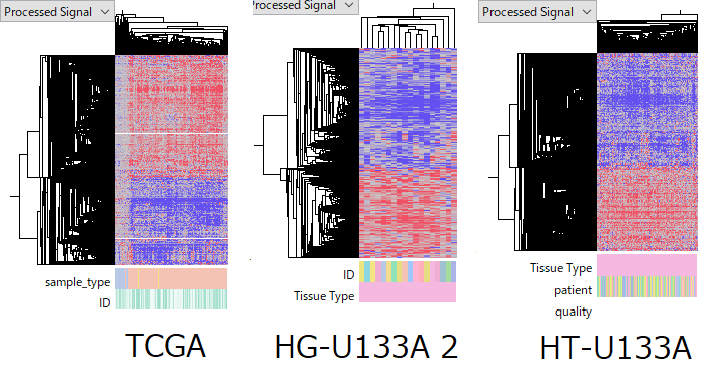
The consistency within each data set.
TCGA-LIHC RNA-Seq data set is composed of 50 normal and 370 primary tumor samples. GSE14520 HG-U133A 2.0 Array data set contains 18 normal-tumor pairs from same patients. And HT-U133A data set does 214 pairs. Although the quality of some samples are arguable, the overall quality is fairly good.
Anyway, tumor samples' expression profiles are roughly similar in all data sets. This fact gives you a reasonable confidence that the data reflects the true gene expression status.
microRNA Expression Data Sets
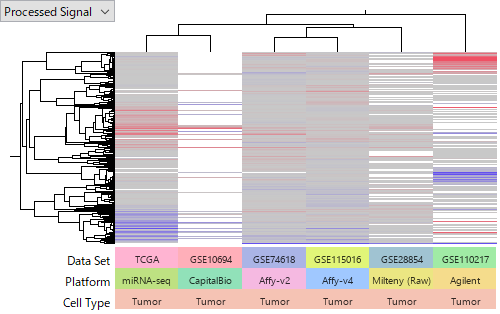
Now let's look at microRNAs' expression data sets. You notice that the results are not consistent like gene expression's. You would think that interpreting miRNA data sets can not be straightforward.
The consistency (or inconsistency) within each data set.
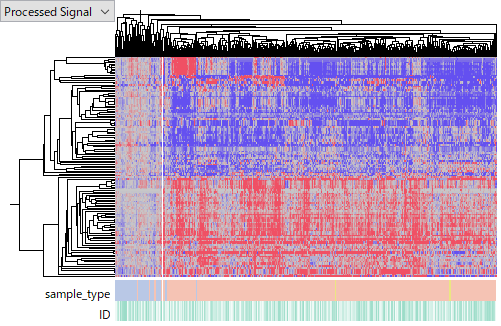
The largest data set is TCGA-LIHC 's miRNA-Seq. The tumor samples share similar miRNA expression profiles according to the heatmap below. It looks working well.
GSE110217 is measured by Agilent Human miRNA v16 microarray. This data set has a problem in data quality. The latter half replicates (5 - 8) has obviously weaker signals than the former half (1 - 4). I guess that the experimenter's skill is not good enough, so I removed the latter half of samples from this analysis. GSE110217 includes normal, non-HCC and HCC groups. And the clustering result shows the distinguished miRNA expression profiles in HCC (the cluster at right). It looks reasonable in the biological context. So it looks working well, too.
However, the detection of up- or down- regulated miRNAs in HCC is not consistent from TCGA's at all. We notice that there is an issue in matching corresponding miRNAs from different platforms, and it can have some effect on this inconsistency. But the observed difference above is more than this effect.
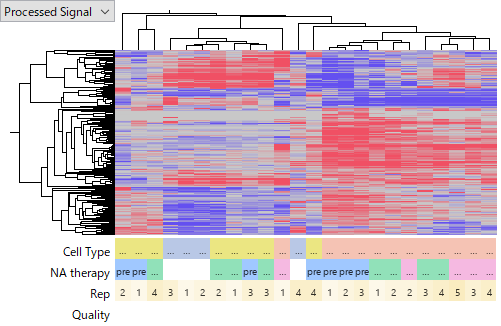
The following heatmaps are of GSE74618 on Affymetrix miRNA v2 Array,
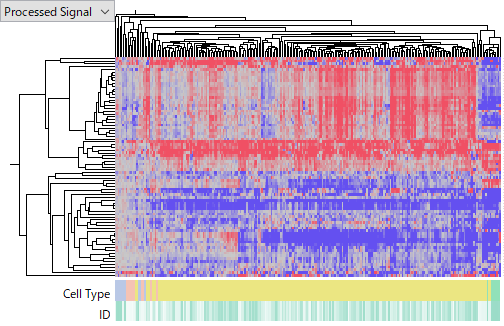
GSE115016 on Affymetrix miRNA v4 Array,
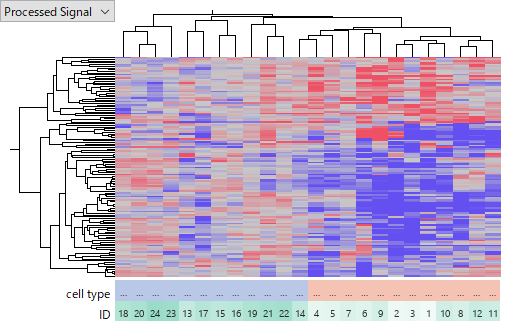
GSE10694 on CapitalBio Mammalian miRNA Array,
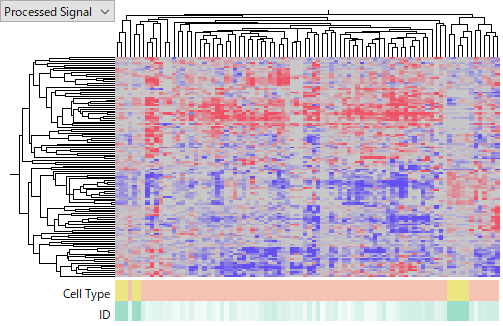
and GSE28854 on Milteny Biotec miRXplore miRNA Microarray.
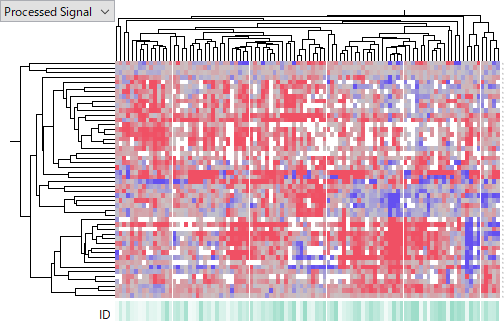
You see that the latter one is more noisier and less concordant among HCC samples. I don't intend to judge which platform is better of worse, because it can be due to technology or experimenters' skill or other factors we don't know. My point is that miRNA expression data is far less reliable than gene expression's. Don't you think that it is very hard to say which miRNA is really up- or down-regulated in HCC?
The difficulty comes from the following the nature of microRNAs.
- The nucleotide sequence of miRNAs is shorter and much more similar than genes.
It makes difficult to stably measure the expression levels of each miRNA. - The number of miRNAs is absolutely smaller than genes.
It makes difficult to normalize resulting the analysis arguable without exception.
Thus comprehensively measuring miRNA is still a challenge which won't be overcome easily. Be careful of using miRNA data sets, or conclusions like up- or down-regulated miRNAs in papers.
And if you are planning an miRNA experiment, it is no doubt that you need the best hand. Contact us if you need our help.
Download the data for your Subio Platform.
If you want to look closer these data sets with Subio Platform by yourself, download the SOA file which works like a bundle of SSA files.
Open "Import Archive..." under Platform menu, and select the SOA file. Subio Platform automatically shuts down when it completes importing. Please restart the software to see the all data sets.