Differential expression analysis of RNA-Seq data commonly uses statistical models based on the negative binomial distribution, such as DESeq2 and edgeR. By contrast, t-tests are often described as "inappropriate for RNA-Seq" or "unsuitable for count data."
This advice is useful, particularly for discouraging the direct application of t-tests to raw gene counts. Raw count data contain many zeros and ones at low expression levels and exhibit a relationship between the mean and variance, often with substantial overdispersion. Negative binomial models account for these characteristics and can improve the stability of dispersion estimates by borrowing information across genes.
However, the situation changes when data have been appropriately normalized, filtered to remove low-expression genes, and log-transformed, and when their distributions and relationships among samples have been examined. The values being analyzed are no longer raw counts. Of course, preprocessing alone does not guarantee that the assumptions of a t-test are satisfied. Methods such as edgeR and DESeq2 may still offer advantages, particularly when dispersion must be estimated from a small number of samples.
Rather than assuming that "negative binomial models are inherently more appropriate" or "t-tests are unsuitable for RNA-Seq," we should consider the characteristics of the data and the assumptions underlying each method.
Why Are t-Tests Generally Discouraged in RNA-Seq Analysis?
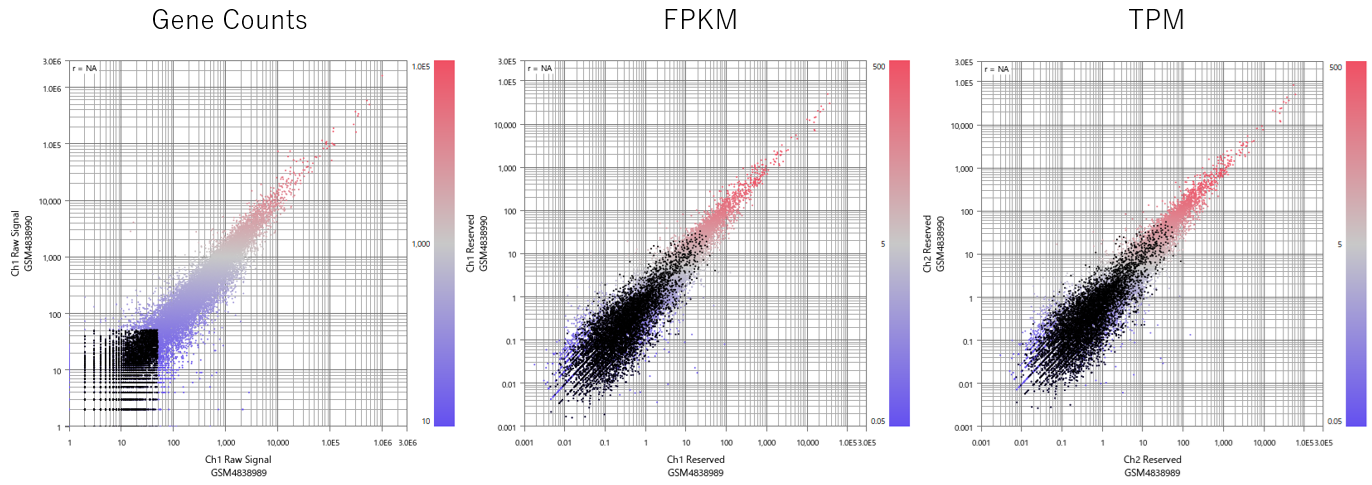
The preference for RNA-Seq-specific statistical methods over conventional t-tests reflects both the statistical properties of count data and practical considerations for performing reliable analyses. One concern is the direct use of normalized expression measures, such as RPKM and FPKM, in statistical tests.
RPKM and FPKM adjust expression values for library size and gene length, but normalization does not make low-count measurements inherently more reliable. For example, a difference between raw counts of 1 and 2 may appear as a twofold change after normalization, even though such measurements can be strongly affected by sampling noise and measurement uncertainty.
TPM was subsequently introduced and is now widely used in place of RPKM and FPKM. Although TPM provides a convenient measure of relative transcript abundance and makes expression values more directly comparable across samples in terms of their scale, it does not eliminate uncertainty associated with low counts, expression-dependent variance, or variability in small-sample experiments. TPM values should therefore not automatically be treated as suitable inputs for conventional statistical tests. They are also inappropriate as inputs to negative binomial count models, which are designed for count data.
Methods such as DESeq2 and edgeR were developed to address these challenges and have become standard tools for RNA-Seq analysis. They work directly with gene counts and incorporate library-size normalization, mean–variance relationships, and dispersion estimation within a unified statistical framework. Another major advantage is that they can be readily integrated into standardized pipelines for efficiently analyzing large datasets.
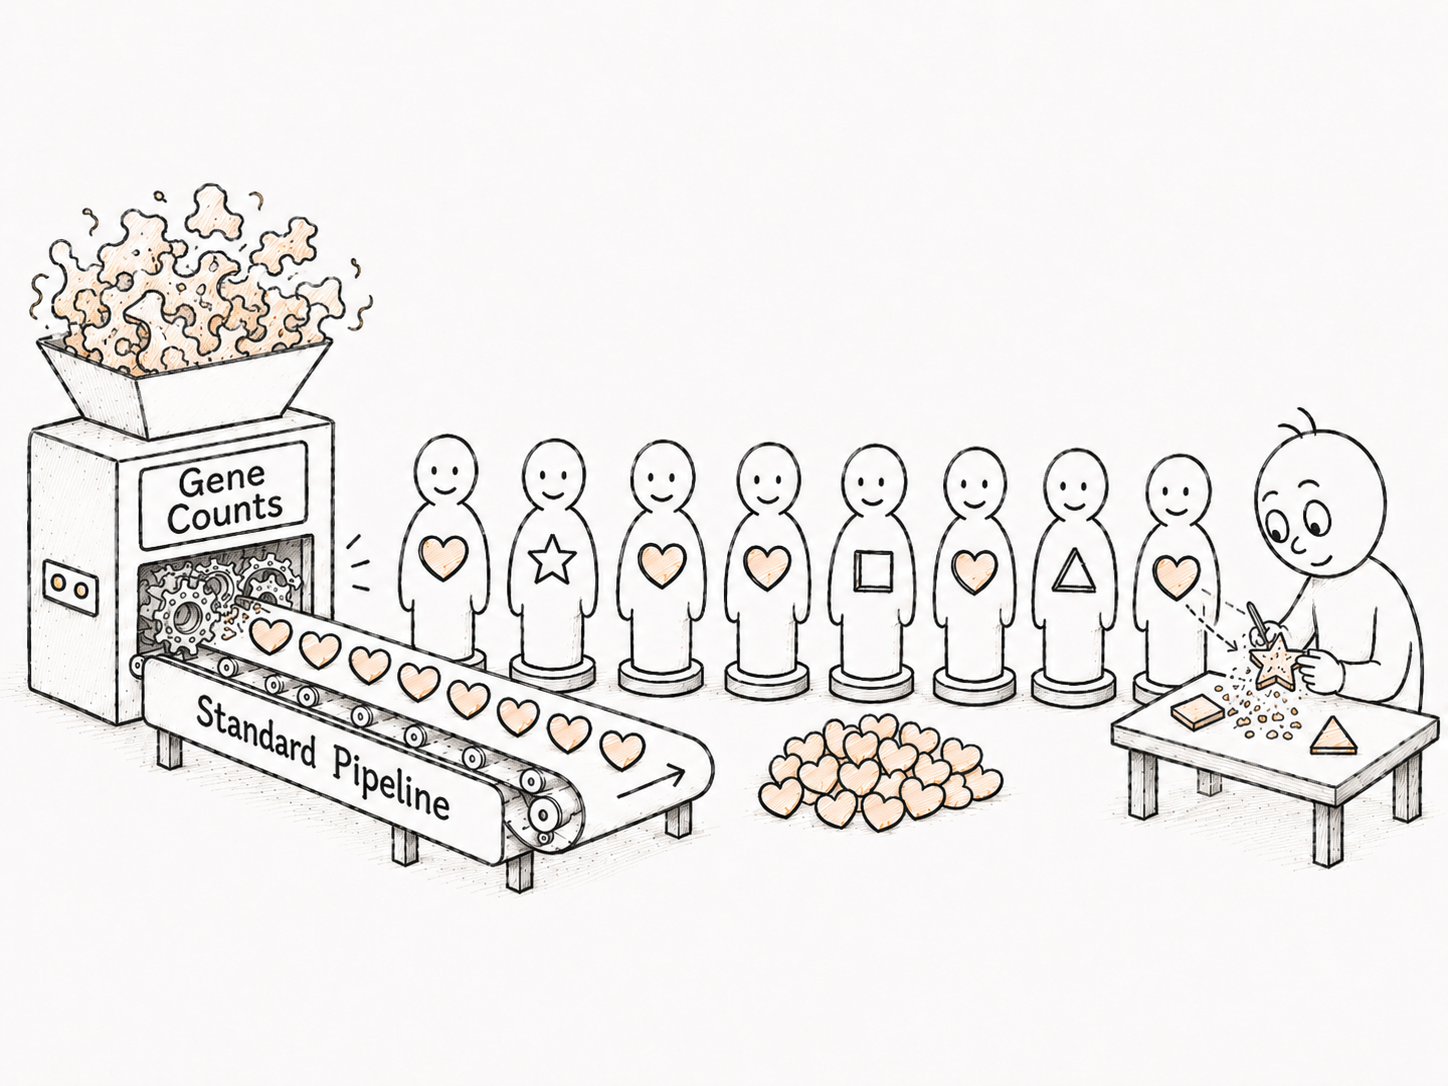
At the same time, the convenience of obtaining results by supplying gene counts to a standard statistical model carries a risk: researchers may accept the output without adequately examining the underlying data. Moreover, the reasonable warning against applying conventional t-tests directly to raw counts should not be taken to mean that t-tests are inherently inferior for every RNA-Seq analysis.
How Do Statistical Methods Differ in the Genes They Detect?
Statistically significant genes may include those with small expression changes and low within-group variance, as well as those with large expression changes and high within-group variance. Although both may be classified as significant DEGs, they may reflect very different biological mechanisms. The former could represent small, consistent responses shared across many cells, or larger changes confined to a subset of cells that are diluted in bulk RNA-Seq measurements. The latter could reflect differences in response magnitude among individuals, disease subtypes, or changes in cell composition. Technical variability and outliers must also be considered.
To understand these expression patterns, it is useful not only to infer possible causes from the observed data, but also to start with a hypothetical biological mechanism and explore the expression patterns it would be expected to produce . In this case study, we use models involving multiple causal genes and inhibitory factors to illustrate why causal genes may not necessarily be identified as typical DEGs. We also propose deliberately selecting genes with p-values near the significance threshold, rather than those with the smallest p-values, and using clustering to search for distinctive expression patterns.
From this perspective, the theoretical validity of a statistical method is not the only consideration. Its practical behavior, including which types of genes it tends to detect and which it may overlook, also matters. For a more detailed discussion of these characteristics and how to select methods for different types of data, see Choosing Between edgeR, DESeq2, and t-Tests for RNA-Seq Differential Expression Analysis: Practical Guidelines by Data Type.
False Positives Can Also Occur with DESeq2 and edgeR
DESeq2 and edgeR are established statistical methods, but they do not necessarily control false positives adequately under all data conditions. A study using large RNA-Seq datasets from human populations reported that these methods could produce more false positives than expected. In permutation analyses, where condition labels were shuffled, the researchers identified substantial numbers of significant genes even though no genuine association with the assigned groups was expected. (Reference: Exaggerated false positives by popular differential expression methods when analyzing human population samples)
Possible explanations include model misspecification, the influence of outliers, and deviations from the intended false discovery rate (FDR) control. Subsequent discussions have also highlighted how outlier handling and the treatment of normalization in simulations can affect estimates of false-positive rates.
In our own analyses of GEO datasets, we have also observed that differences in the low-count regions of expression distributions and in effective detection limits among samples can affect the results. (See case studies: No. 426, illustrating a pattern observed in a medium-sized dataset, and No. 403, illustrating a case in which the analysis results were substantially distorted.)
Normalization and Batch Effect Correction Can Make Data Problems Harder to Detect
Normalization and batch effect correction are important steps in RNA-Seq analysis, but applying them does not automatically make the data reliable. We compared TMM, DESeq2 VST, quantile normalization, and ComBat to examine how these methods affect expression distributions and clustering patterns. We found that problematic sample patterns could persist after correction and that some groups of genes could appear to have relatively higher expression after processing.
The key is to compare the data before and after processing and consider what the observed expression patterns actually represent.
Manually Examining Data Is Not an Outdated Practice
Examining data manually throughout an analysis is neither outdated nor necessarily inefficient. Inspecting expression distributions before and after normalization, the effects of low-expression genes, sample separation in PCA, clustering patterns, and individual gene expression profiles can reveal problems that may be difficult to identify from automated results alone.
For example, when PCA shows that samples cluster by experimental date rather than experimental condition, simply applying a batch correction algorithm may not be sufficient. Likewise, statistical DEG analysis may exclude genes that could be biologically important and warrant closer examination. In either case, it is important to investigate possible explanations for the observed patterns and, when necessary, reconsider the analysis methods or the genes being examined.
Automated statistical analysis and visual inspection by researchers are complementary rather than competing approaches. Combining their strengths and making decisions based on the data and research objectives can lead to more reliable and meaningful analyses.
Explore These Ideas with Real RNA-Seq Data
Our RNA-Seq Data Analysis Tutorial: Learning the Workflow and How to Interpret Results Using GEO Data demonstrates how to analyze real data without relying blindly on statistical models. It covers the workflow from importing gene counts through normalization, filtering, PCA, clustering, differential expression analysis, and enrichment analysis, with opportunities to examine the data at each stage.
In addition, RNA-Seq Differential Expression Analysis with edgeR and DESeq2 Using ChatGPT explains how to export gene counts from Subio Platform, use ChatGPT to generate R scripts for statistical analysis, and import the results back into Subio Platform for visualization and validation.
This hands-on experience helps researchers understand the characteristics of RNA-Seq data and the behavior of different analysis methods, while also providing a foundation for developing better automation strategies. It is valuable not only for experimental biologists but also for bioinformaticians who design analysis pipelines and software systems.