When choosing RNA-Seq analysis software, many researchers consider whether it can quantify gene expression from FASTQ files, perform differential expression analysis, generate volcano plots and heatmaps, and carry out GO and pathway enrichment analysis.
These are, of course, important capabilities. But RNA-Seq analysis involves more than generating results. Researchers also need to assess whether the results are reliable rather than being driven by technical artifacts, biases, or batch effects, and whether the analysis identifies expression patterns relevant to their research questions. For example, identifying major changes in cellular activity and identifying factors that may be responsible for those changes require different analytical approaches.
AI-generated code and automated analysis tools that operate through a web browser are likely to make RNA-Seq analysis increasingly accessible. However, making an analysis easier to run does not guarantee that its results are correct. In fact, pipelines that simply execute popular tools without examining the characteristics of the data or considering whether the statistical models are appropriate for the research question risk producing large amounts of seemingly convincing but potentially misleading results.
Similar concerns were raised in a 2026 workshop report on pitfalls in data analysis (in Japanese). Issues surrounding reproducibility and data interpretation in RNA-Seq analysis also continue to be discussed internationally. For example, "Designing RNA sequencing experiments: A practical guide to reproducible gene expression analysis" discusses the importance of experimental design, selecting appropriate analytical methods, data visualization using approaches such as PCA and clustering, validation of analysis results, and interpretation in the context of biological knowledge.
AI Will Further Accelerate RNA-Seq Analysis Automation
Traditionally, performing RNA-Seq analysis required researchers to learn Linux commands, R, Python, statistical methods, and how to use various analysis tools. Today, however, AI can generate commands for running Salmon or kallisto, R code for creating gene-level count tables with tximport, scripts for calculating p-values using edgeR or DESeq2, and code for generating volcano plots and heatmaps. These developments are making RNA-Seq analysis increasingly automated. Writing code and running analysis tools, once major barriers to entry, are becoming less demanding.
Furthermore, AI agents are emerging that can perform analyses themselves rather than merely generate code . However, being able to generate code is not the same as being able to perform a valid analysis . AI can generate analysis code, but it does not automatically determine whether a particular procedure is appropriate for the data being analyzed.
Real RNA-Seq Data Present Challenges That Statistical Models Alone Cannot Resolve
Statistical methods used in RNA-Seq analysis are designed to evaluate differential expression while accounting for variability in count data and differences between samples. However, they cannot be applied to every dataset without considering their assumptions. Researchers still need to examine whether normalization assumptions are appropriate, whether extreme outliers or batch effects influence the results, and whether the experimental design is suitable for the research question.
Real RNA-Seq datasets may contain problems that cannot be adequately assessed through statistical modeling alone. RNA quality, sample input amount, cellular composition, library preparation, sequencing depth, mapping rates, variability among genes with low expression, outliers, and batch effects can all influence the results.
In particular, RNA-Seq datasets obtained from public databases, biopsy-derived samples, low-input RNA-Seq experiments, or samples with different cellular compositions may show substantial variation in data quality and expression distributions. For such datasets, examining the data before applying statistical methods is essential.
Nevertheless, processing data with AI-generated code or automated analysis tools can still produce results that appear convincing. The problem is that examining individual results in isolation cannot establish whether the observed differences reflect genuine biological variation or biases arising from data quality and distribution. As discussed in this article on evaluating consistency across analysis results , the overall consistency of an analysis cannot be assessed by examining each result independently.
Differential Expression Analysis Is Not Simply a Matter of Using edgeR, DESeq2, or limma
Methods such as edgeR, DESeq2, and limma are widely used for differential expression analysis of RNA-Seq data. These are important statistical methods that have played a major role in the development of RNA-Seq analysis. However, simply applying a well-established statistical model is not enough. The questions addressed by differential expression analysis are not necessarily the same as those researchers ask when searching for biologically important genes.
In practice, the expression patterns of interest depend on the research objective. Consequently, the aspects of the data that need to be examined and the analytical methods best suited to the task may also differ. For example:
- Are you looking for genes with large differences in expression levels between groups?
- Are you looking for consistent changes with low within-group variability?
- Are you interested in genes with low expression that exhibit ON/OFF-like changes under specific conditions?
- Are you trying to identify previously unrecognized subclusters?
- Do you need to evaluate changes using a paired design that accounts for individual differences?
RNA-Seq Analysis Software Needs to Do More Than Generate Results
When choosing RNA-Seq analysis software, it is important to consider not only which analyses it can automate, but also how thoroughly you can explore the data and investigate potential problems through exploratory data analysis (EDA) .
EDA is not limited to quality control (QC) or outlier detection. For a broader discussion of how EDA can lead to new research questions and biological discoveries, see this article.
Case Studies Using Real RNA-Seq Data
Using the same RNA-Seq dataset (GSE173789), we investigated the reliability of analysis results and the challenges involved in validating them from three perspectives: data visualization, a standard analysis workflow, and an automated analysis tool.
- Identifying Problems Through Data Visualization — In samples with low read counts, normalization can sometimes make certain genes appear to have relatively higher expression levels. We examined how these data characteristics and sample composition can affect differential expression analysis and biological interpretation.
- RNA-Seq Analysis Using a Standard Galaxy Workflow — QC reports generated by individual tools provide valuable information. However, our investigation highlighted the difficulty of integrating these reports with gene expression data and comparison results to assess the validity of the analysis as a whole.
- Automated RNA-Seq Analysis Using RaNA-Seq — Automation makes the analysis process easier, but it does not necessarily ensure that researchers receive enough information to assess the reliability and validity of the results. How automated tools can communicate potential problems and highlight issues that require further investigation remains an important challenge.
- Automated RNA-Seq Analysis Using RNAseqChef — RNAseqChef offers a wide range of analysis and visualization features. However, even when PCA plots or heatmaps reveal unusual patterns, it is difficult to investigate their underlying causes by tracing specific samples or genes across different visualizations. Our evaluation highlights the difference between having extensive analysis capabilities and being able to assess the reliability of the results.
- RNA-Seq Analysis Using iDEP — iDEP offers a wide range of analysis and visualization features. However, even when PCA or heatmaps reveal unusual sample patterns, it may not be easy to investigate their causes or assess their impact on the results. This case study examines the difference between having many analysis features and being able to evaluate the reliability of the results.
These case studies are not intended to rank analysis tools or determine which software is superior. Rather, they illustrate the difference between obtaining results and being able to understand and validate them.
Furthermore, making meaningful discoveries requires more than following a fixed, standard analysis procedure. Running a standard workflow does not necessarily mean that the analysis is optimal for the research objective. In fact, it may even cause researchers to overlook findings that could otherwise have been discovered. For this reason, omics data analysis requires not only the ability to reproduce established procedures, but also the creativity to select and adapt analytical approaches to the research question.
Combining Automation with Data Inspection Is a Practical Approach
Automation itself is not the problem. Processing FASTQ files, generating expression tables, calculating p-values using edgeR or DESeq2, and creating graphs can all be made more efficient with AI and existing analysis tools. Automating routine procedures can greatly improve efficiency. The problem arises when automatically generated results are accepted as conclusions without examining them in the context of the data and the research objectives.
In research settings where large volumes of data must be processed, a practical approach is to generate results efficiently through automation while visualizing and examining those results and assessing whether they are appropriate for the research objectives.
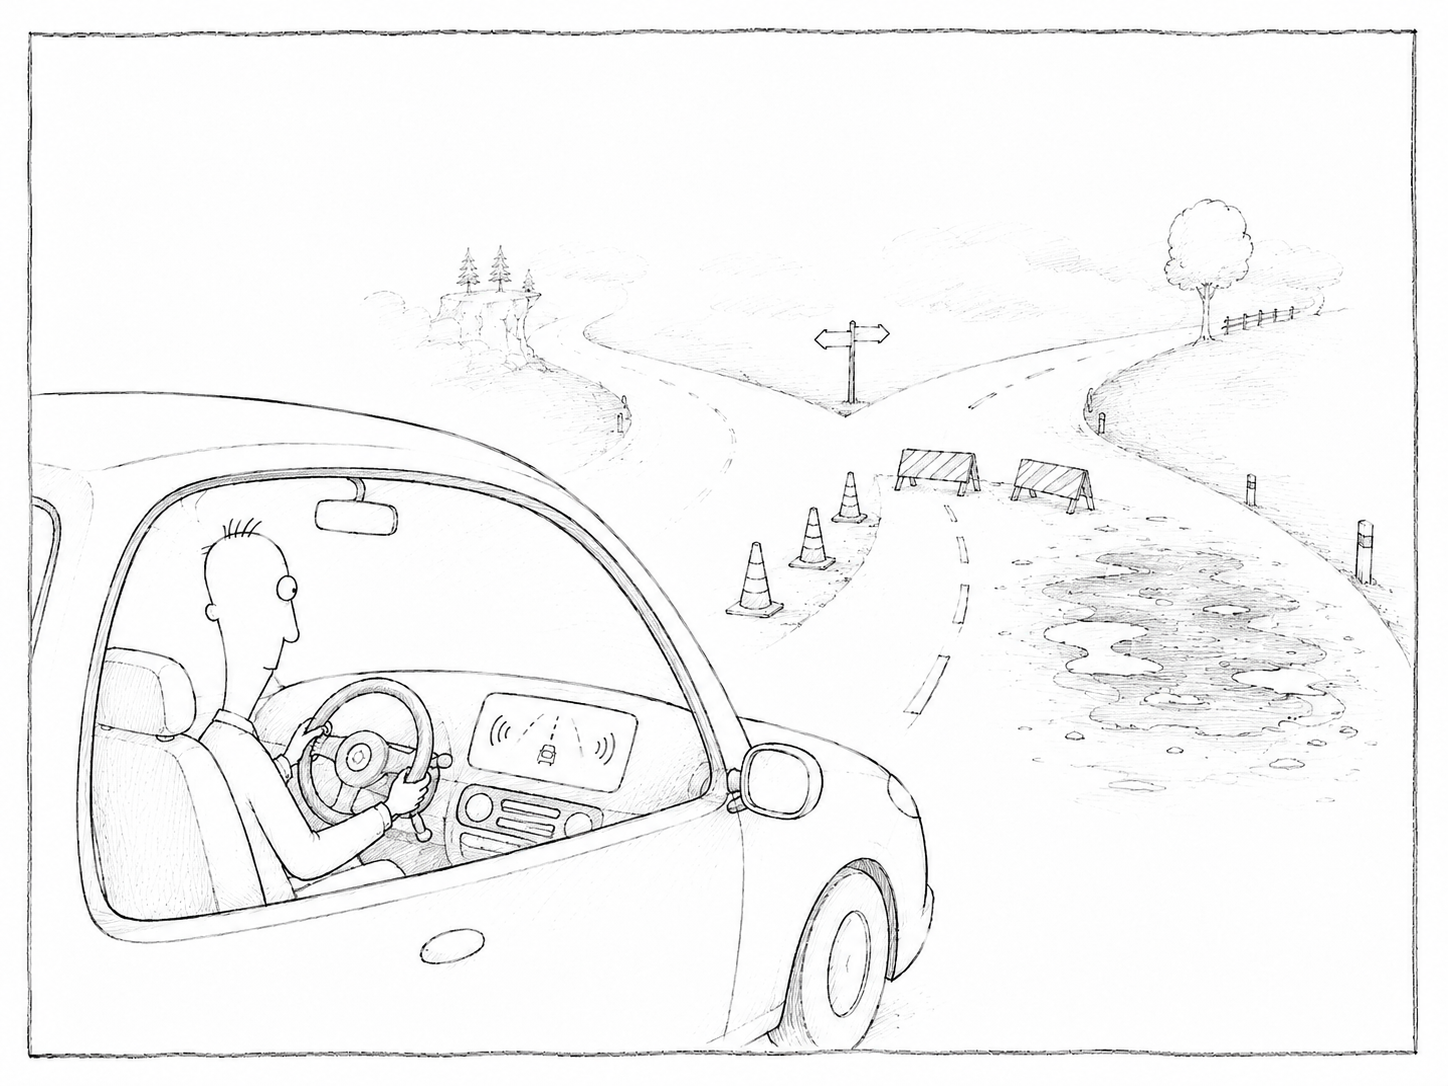
What to Look for When Choosing RNA-Seq Analysis Software
In addition to standard analysis capabilities, we recommend considering whether the software allows researchers to:
- Distinguish between and appropriately handle Gene Counts, TPM, FPKM, and RPKM.
- Examine data distributions before and after normalization.
- Investigate whether specific expression patterns may reflect technical artifacts or biases in the data.
- Examine low-count regions and missing values.
- Evaluate differential expression results not only through p-values, but also by examining the underlying expression patterns.
- Relate GO and pathway enrichment results back to the original expression data.
- Compare and integrate results obtained using other analysis tools.
- Reconsider analytical methods and selection criteria according to the research objective, rather than being restricted to a fixed workflow.
Subio Platform: RNA-Seq Analysis Software Designed to Help Researchers Examine Data and Make Informed Decisions
Subio Platform is RNA-Seq analysis software that allows researchers to import gene expression data such as Gene Counts, TPM, and FPKM, and perform normalization, filtering, PCA, clustering, heatmap visualization, examination of differential expression results, and GO and pathway enrichment analysis. However, Subio Platform focuses on more than simply generating results. It is designed to help researchers visualize, understand, and validate their data and results, return to the underlying expression data when necessary, and assess whether the analysis is appropriate for their research objectives.
Reviewing, Sharing, and Reanalyzing Results Is Also Important
RNA-Seq analysis should not end when the initial results are obtained. It is also important to be able to review those results later, share them with others, and reanalyze the data under different conditions. Saving analysis procedures and visualization settings along with the data makes it easier to share results within a laboratory and allow other researchers to reexamine the same data.
Subio Platform allows researchers to preserve analysis data in a reusable format and share it through SSA files. This makes it possible to reopen the same results quickly, review them, and perform further analyses. Building a reusable and shareable collection of analysis datasets can strengthen not only individual research workflows, but also the analytical capabilities of an entire laboratory. For more information, see How Subio Platform's Free Core Features Support Omics Data Analysis Without Plug-ins.
For a practical introduction to the analysis process, see our RNA-Seq Data Analysis Tutorial, which emphasizes not only the procedures involved, but also the reasoning and decisions required at each step.