In RNA-Seq analysis, it is common to identify differentially expressed genes (DEGs) and use the resulting gene lists for enrichment analysis, such as Gene Ontology (GO) and pathway analysis. But have you carefully considered whether your input gene list actually contains the genes relevant to your research question?
What kind of gene list should you use for enrichment analysis in the first place?
Enrichment analysis examines which biological functions are overrepresented in an input gene list. However, it does not determine whether that list is appropriate for your research objective. In this article, we use a simple example involving multiple treatments to explore how gene lists can be constructed. We also examine how the statistical thresholds used to identify DEGs can affect both the composition of those lists and the results of enrichment analysis.
1. Consider a Common Experimental Design
Suppose we have three experimental conditions: Control (Ct), Treatment 1 (T1), and Treatment 2 (T2). Our primary interest is in T1. Although T2 has effects similar to those of T1, our goal is to identify characteristics specific to T1.
We begin with three comparisons.
| Comparison | Upregulated | Downregulated | Neither |
|---|---|---|---|
| Ct vs T1 | UP1 | DOWN1 | Non-DEG1 |
| Ct vs T2 | UP2 | DOWN2 | Non-DEG2 |
| T1 vs T2 | UP3 | DOWN3 | Non-DEG3 |
Here, UP3 represents genes expressed at higher levels in T1 than in T2, while DOWN3 represents genes expressed at lower levels in T1 than in T2.
To keep the example simple, we will initially set aside statistical testing. Instead, we classify a gene as UP if its expression increases at least twofold, DOWN if its expression decreases to half or less, and neither otherwise. We will focus on UP1 and leave DOWN1 aside for now.
Consider the following four genes.
| Gene | Ct | T1 | T2 |
|---|---|---|---|
| Gene A | 100 | 200 | 100 |
| Gene B | 100 | 200 | 190 |
| Gene C | 100 | 400 | 200 |
| Gene D | 100 | 200 | 50 |
All four genes show at least a twofold increase in T1 compared with Ct, but their responses to T2 differ.
- Gene A: Expression increases in T1 but remains unchanged in T2. This is a representative example of the type of gene we are looking for.
- Gene B: Expression increases to nearly the same extent under both treatments. However, its expression in T2 falls just below the threshold for classification as UP. This is a representative example of a gene that does not match our research objective. Because T1 and T2 have similar effects, we can expect many genes to exhibit an expression pattern similar to Gene B.
- Gene C: Expression increases fourfold in T1 and twofold in T2. Since expression also increases substantially in T2, whether Gene C belongs in our gene list depends on how we interpret its response to T2.
- Gene D: Expression increases in T1 but decreases in T2. As with Gene C, whether we want to include Gene D depends on how we interpret its response to T2.
Using these four genes, let us consider how to construct a gene list suitable for enrichment analysis.
2. What Does UP1 NOT UP2 Tell Us?
If we want to identify genes whose expression increases specifically in T1, one of the first approaches that comes to mind is:
UP1 NOT UP2
This selects genes classified as UP in T1 but not classified as UP in T2.
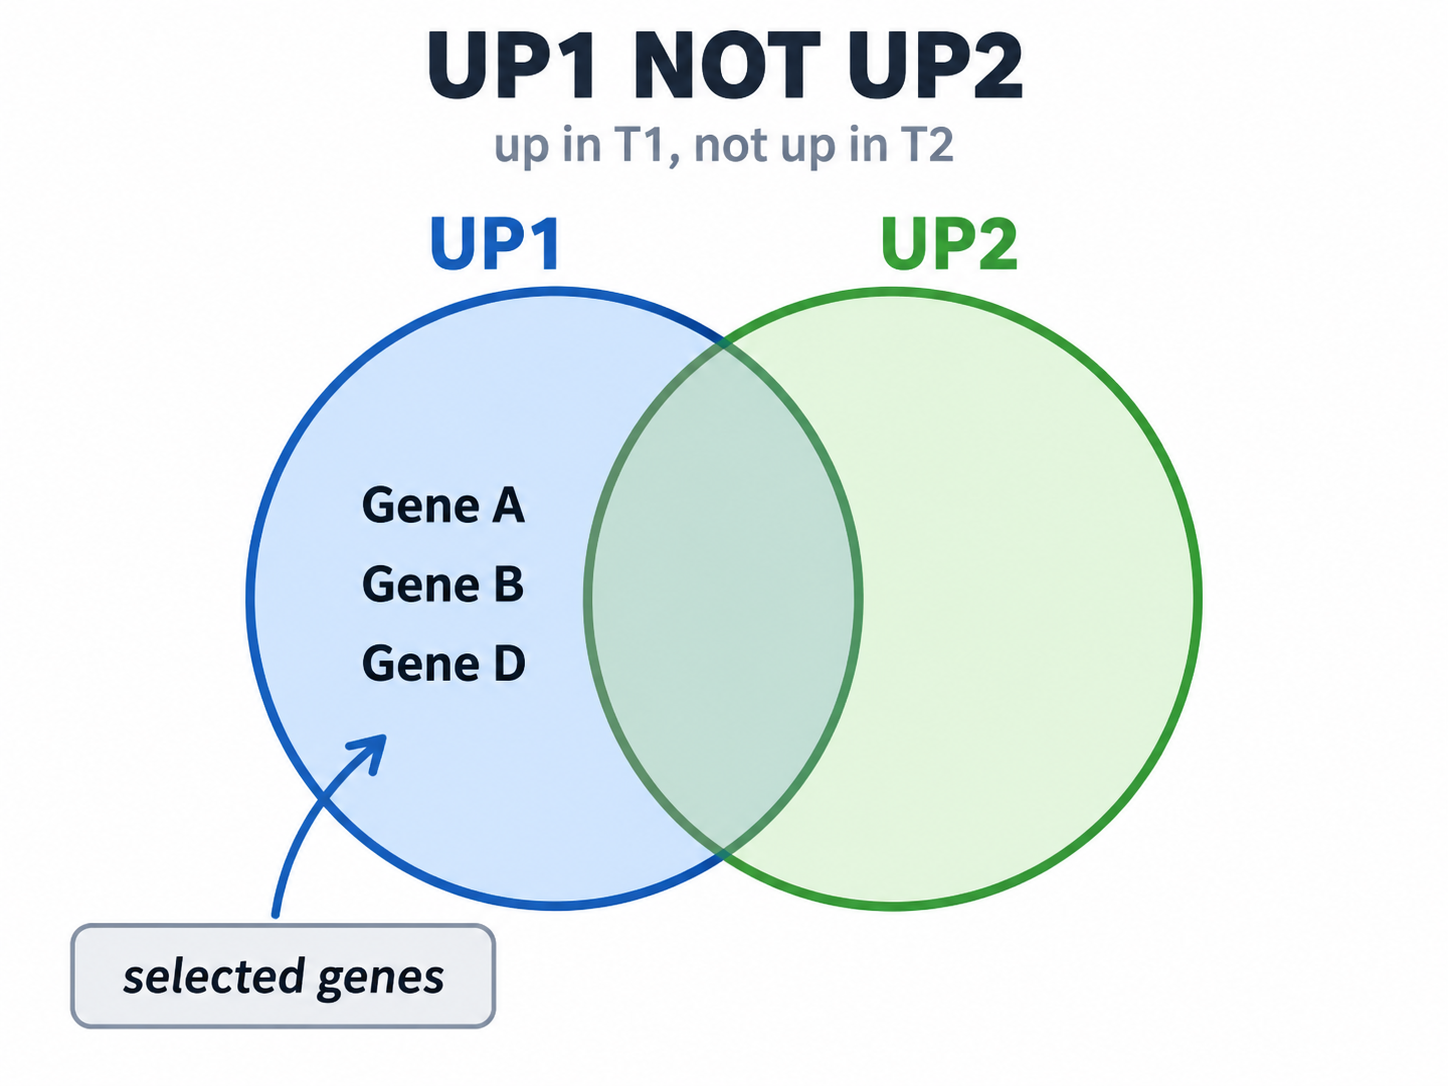
In our example, this list contains Genes A, B, and D. Notice that Gene B is included. A gene's inclusion in UP1 NOT UP2 does not necessarily mean that it responds very differently to T1 and T2. Furthermore, we can expect many genes like Gene B to be included in this list.
If we perform enrichment analysis on this list, GO terms or pathways associated with biological responses shared by both treatments might appear to represent functions specific to Treatment 1.
3. UP1 ∩ UP3 Accounts for Differences Between Treatments
What about the following gene set?
UP1 ∩ UP3
UP1 contains genes whose expression increases in T1 compared with Ct, while UP3 contains genes expressed at higher levels in T1 than in T2. Combining these two conditions allows us to identify genes that are upregulated in Treatment 1 relative to the control and are also expressed at higher levels in Treatment 1 than in Treatment 2.
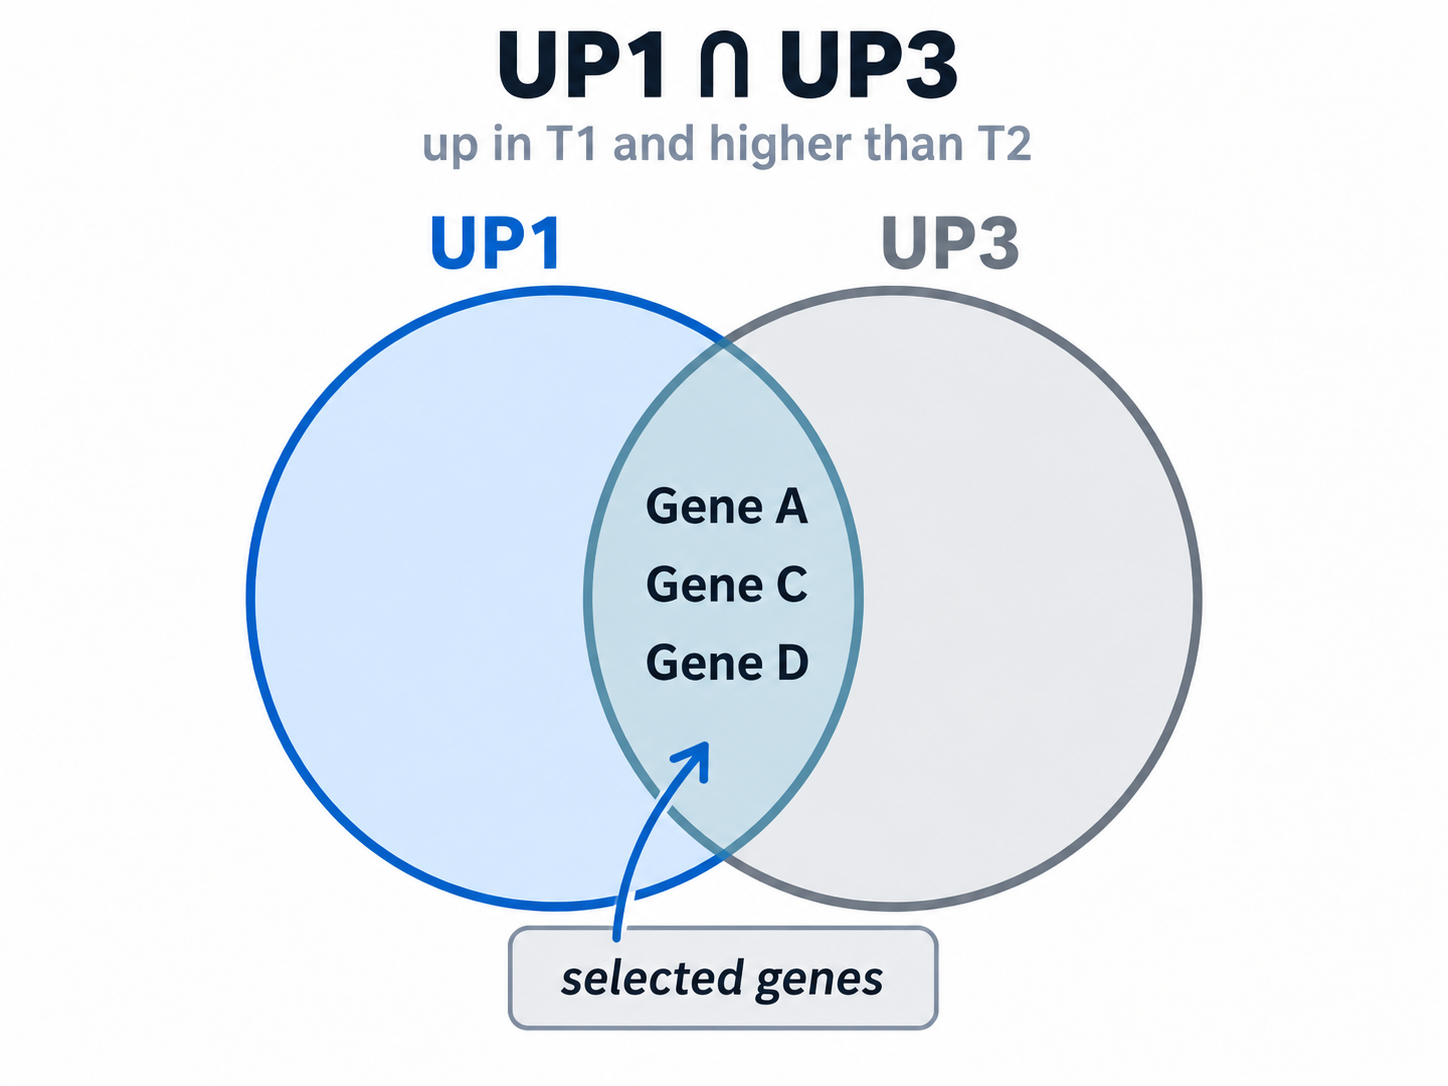
Among our four example genes, this set contains Genes A, C, and D. Gene B is excluded. Compared with UP1 NOT UP2, this approach is better aligned with our research objective because it directly accounts for differences between the two treatments.
However, Gene C still deserves consideration. If its elevated expression in T2 reflects a biological effect shared by T1 and T2, we might prefer a list that excludes Gene C.
4. (UP1 ∩ UP3) NOT UP2 Narrows the Focus Further
Suppose we want genes whose expression increases in T1 and is higher than in T2, but which are not classified as UP in T2. We can construct the following set:
(UP1 ∩ UP3) NOT UP2
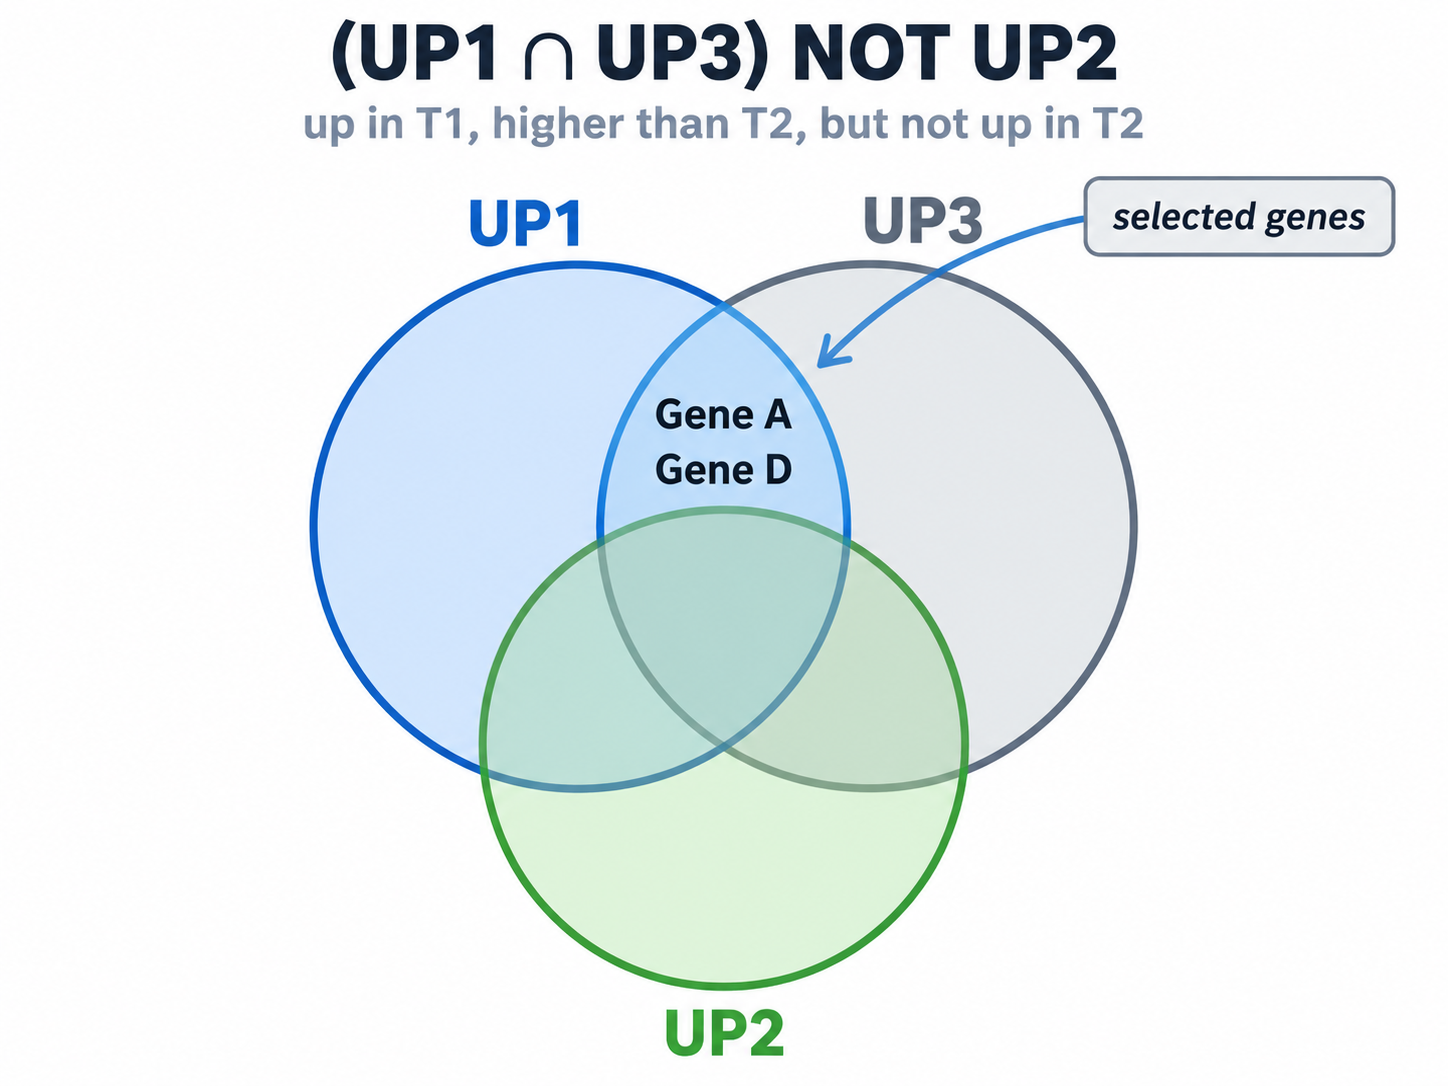
With this approach, only Genes A and D remain from our four example genes.
Gene D is also interesting because its expression changes in the opposite direction under Treatment 2. This makes it interesting for a different reason than Gene A. If we also want to exclude genes that decrease in Treatment 2 and focus instead on genes that show no substantial change under Treatment 2, we could use:
UP1 ∩ UP3 ∩ Non-DEG2
This is another possible way to define the gene set.
These examples demonstrate that the way we construct an input gene list for enrichment analysis can change which biological functions emerge from the analysis.
5. What Happens When We Apply More Stringent DEG Thresholds?
So far, we have classified genes as UP or DOWN based only on fold change to simplify the explanation. In actual RNA-Seq analysis, however, statistical tests are used to identify DEGs. Reviewers also commonly request stricter control of false positives, for example through the use of FDR thresholds.
Let us consider how this stringency affects the gene lists used in subsequent enrichment analysis. We assume that T1 and T2 have broadly similar effects. Under these conditions, we would expect many genes, like Gene B, to show similar expression changes under both treatments.
As we make the statistical threshold more stringent, more genes are excluded from both UP1 and UP2. Even Type A genes, which are precisely the genes we want to identify, may largely be excluded from UP1, resulting in more false negatives. Similarly, many Type B genes, which show similar responses to both treatments, are excluded from both UP1 and UP2. However, among the small fraction of Type B genes that meet the significance criterion, some may be classified as belonging exclusively to UP1, exclusively to UP2, or to both.
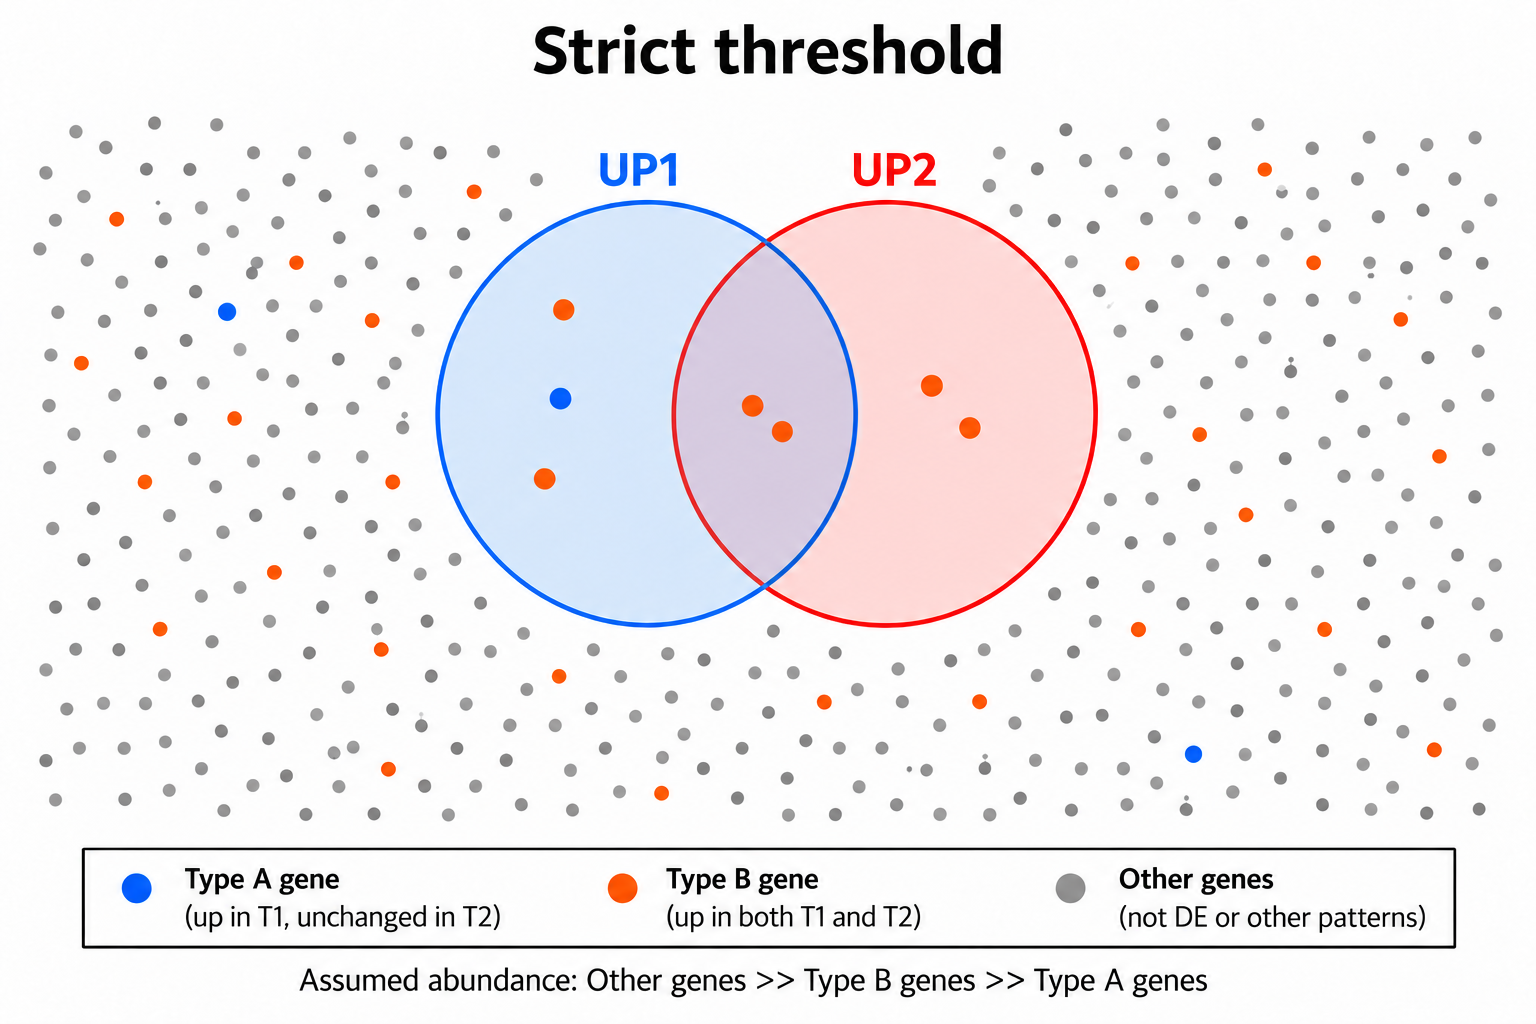
Consequently, UP1 NOT UP2 may retain only a small number of genes truly characteristic of T1 while also including genes that actually show similar responses to both treatments. Moreover, the proportion of Type B genes does not necessarily decrease.
Similar problems arise with sets such as UP1 ∩ UP3 and (UP1 ∩ UP3) NOT UP2. Because genes must satisfy multiple conditions simultaneously, stringent thresholds can cause even more potentially relevant genes to be excluded. The resulting gene lists may become very small, or almost empty, leaving few genes available for enrichment analysis.
In other words, identifying DEGs using stringent statistical criteria does not necessarily produce a gene list suitable for enrichment analysis.
6. Relaxing the Threshold May Actually Bring Us Closer to Our Research Objective
What happens if we relax the statistical threshold? For example, consider relatively permissive criteria such as nominal p-value cutoffs of 0.05, 0.1, or even 0.2.
Relaxing the threshold makes individual gene lists such as UP1 and UP2 larger, with more false positives. But what happens when we combine these lists instead of evaluating them individually?
Type B genes are particularly interesting here. As the threshold is relaxed, more Type B genes are included in both UP1 and UP2. Consequently, the intersection of UP1 and UP2 grows, and the genes remaining in UP1 NOT UP2 may become more representative of expression patterns characteristic of T1.
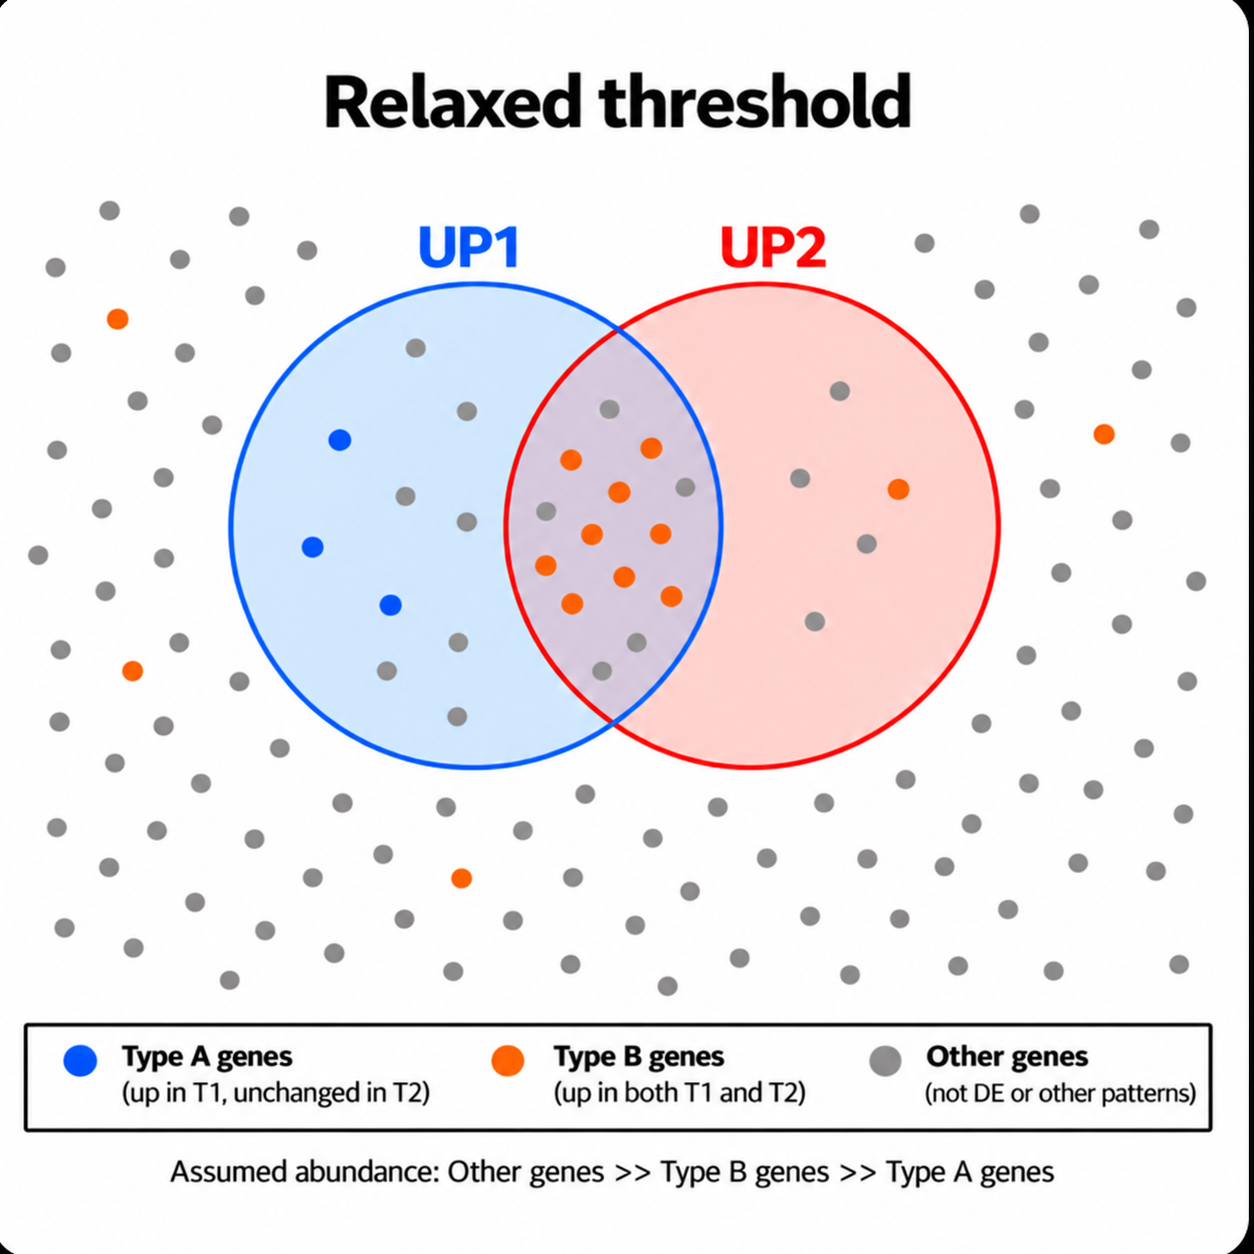
Thus, relaxing the statistical threshold can sometimes change the composition of a gene set in a way that better matches the research objective.
On the other hand, relaxing the threshold also makes it easier for genes to be classified as UP3. Even genes with relatively small differences between treatments may be included in UP3, potentially allowing genes that do not match our objective to enter UP1 ∩ UP3.
This is where (UP1 ∩ UP3) NOT UP2 becomes useful. Combining UP1 and UP3 identifies genes that are upregulated in Treatment 1 relative to the control and are expressed at higher levels than in Treatment 2. Excluding UP2 further removes genes that are also upregulated in Treatment 2.
In this way, the impact of statistical stringency on individual gene lists and its impact on gene sets constructed by combining those lists must be evaluated using fundamentally different criteria.
7. How Do False-Positive DEGs Affect Enrichment Analysis?
Now let us consider the issue from a different perspective. How does an increase in false-positive DEGs caused by relaxing the statistical threshold affect enrichment analysis?
If false-positive genes are included randomly with respect to biological function, an increase in gene-level false positives does not necessarily lead to an increase in false-positive enrichment results. In fact, recovering genes associated with a biological function that narrowly missed the original significance cutoff may strengthen the enrichment signal.
Conversely, applying a more stringent threshold may exclude many genes associated with a biological function simply because their statistical significance falls near the cutoff. This can weaken the corresponding enrichment signal.
In other words, the effect of statistical stringency on the composition of a gene list and its effect on enrichment results are fundamentally different considerations.
Therefore, rather than treating any single DEG threshold as the universally correct choice, it is important to examine how the composition of gene sets and the results of enrichment analysis change as the threshold is varied. Such comparisons can provide valuable insights for biological interpretation.
8. Why Is This Way of Thinking So Important?
So far, we have explored how to construct input gene lists for enrichment analysis and how the statistical thresholds used in DEG analysis can affect the results.
However, these issues often receive little attention in conventional RNA-Seq analysis workflows.
A typical workflow proceeds as follows:
Gene Counts → DEG Analysis → Enrichment Analysis → Biological Interpretation
There is an easily overlooked problem with this sequence. The analytical tools used at each step are not necessarily designed to answer the same question.
DEG analysis statistically evaluates expression changes for individual genes. Applying a stringent FDR threshold to control false positives serves a clear purpose. The problem arises when a DEG list selected solely with this objective in mind is passed directly to enrichment analysis without further consideration.
Arguments that "FDR thresholds should be more stringent" and that "statistical thresholds should be relaxed" suffer from the same problem if either approach is imposed indiscriminately, without examining the actual data or considering the research objective.
What matters is not which criterion is generally considered correct, but what actually happens in the analysis. In other words, rather than following a one-way analytical workflow, examining what changes as we vary the thresholds can lead to deeper biological insights.
Such comparisons used to require considerable time and effort. Today, however, we can provide DEG lists and enrichment analysis results to AI tools and ask them to compare and summarize the differences across thresholds, including which biological features emerge or disappear. This allows researchers to devote more time and attention to interpreting the results and validating their biological relevance.
Analysis is not simply about completing a prescribed sequence of analytical steps. Enrichment analysis is not merely a matter of submitting a gene list and obtaining a table of GO terms or pathways.
What kind of gene list did we construct? What did it reveal, and what did it fail to reveal? Thinking through these questions is, I believe, fundamental to enrichment analysis.
Master Analysis, Not the Tool.
Subio Platform provides an environment where you can visualize results obtained using AI, R, Python, and other tools, and validate their reliability yourself. You can also share your results and use them as a basis for discussion.
Visualize and validate your results.
Subio Platform | RNA-Seq Data Analysis Service