Two Traditional Goals of Bioinformatics Education
Bioinformatics education has traditionally pursued two major goals. The first is providing the foundational knowledge needed for data analysis. Bioinformatics draws on a broad range of disciplines, including molecular biology, statistics, algorithms, and databases. Educational programs have been developed to help students acquire this knowledge systematically.
The second is developing the practical skills needed to perform analyses. In recent years, hands-on workshops and online learning materials have become increasingly accessible, providing more opportunities to learn programming and the practical use of analysis tools. These programs often emphasize the "learn by doing" approach. If beginners were expected to fully understand the details of statistical models and algorithms before starting an analysis, it would take considerable time before they could work with actual data. Allowing learners to complete an analysis first and gradually acquire the necessary knowledge is therefore a reasonable educational approach.
In recent years, however, increasing attention seems to be directed toward another question: Does acquiring knowledge and learning to use analysis tools necessarily mean that someone can perform the data analysis required for scientific research?
Completing an Analysis Is Not the Same as Analyzing Data Correctly
Imagine attending a hands-on RNA-Seq analysis workshop. You start with FASTQ files, obtain gene counts, identify differentially expressed genes (DEGs) using DESeq2, generate PCA plots and heatmaps, and perform enrichment analysis. Successfully completing the entire workflow without errors would certainly give participants a sense of accomplishment.
However, such workshops often use datasets that have been carefully selected and prepared to ensure that participants can complete the exercises. As a result, they may not adequately address how to respond when encountering problems such as the following:
- What if unexpected differences exist in gene expression distributions among samples?
- What if PCA reveals sample groups that do not correspond to the original experimental groups?
- What if including or excluding a particular sample substantially changes the DEG analysis results?
- What if biologically important information lies in within-group variability rather than differences in mean expression?
When learners apply their newly acquired knowledge and skills to real research data, analysis tools may run normally and produce DEG lists and enrichment analysis results even when such problems are present. Furthermore, the results may appear entirely plausible, sometimes even agreeing with established biological knowledge.
The fact that an analysis runs successfully does not guarantee that the methods are appropriate for the data or that the results are valid. Related concerns are discussed in "Designing RNA sequencing experiments: A practical guide to reproducible gene expression analysis". This review emphasizes that obtaining reproducible and biologically meaningful RNA-Seq results requires comprehensive consideration of experimental design, analytical methods, quality control, visualization, and interpretation.
The "learn by doing" approach is valuable. However, it becomes problematic if learners begin to equate successfully running a workflow with understanding the analysis, or obtaining results with being able to analyze data properly.
A Third Perspective on Bioinformatics Education
This brings us to another educational goal: developing the ability to critically evaluate analysis results. In an earlier article, we discussed how to learn RNA-Seq data analysis in the AI era. Here, I would like to examine this third educational goal in greater depth.
What Does It Mean to Critically Evaluate Analysis Results?
When people hear the phrase "critically evaluate analysis results," they may think of questions such as:
- Should DESeq2 or edgeR be used?
- Was the normalization method appropriate?
- Should the FDR threshold be 0.05 or 0.1?
- How should the fold-change threshold be determined?
- Is WGCNA superior to hierarchical clustering?
The internet contains numerous discussions comparing analytical algorithms and evaluating the statistical validity of different methods. When asked about the reliability of analysis results, AI systems also frequently begin by addressing questions of this kind.
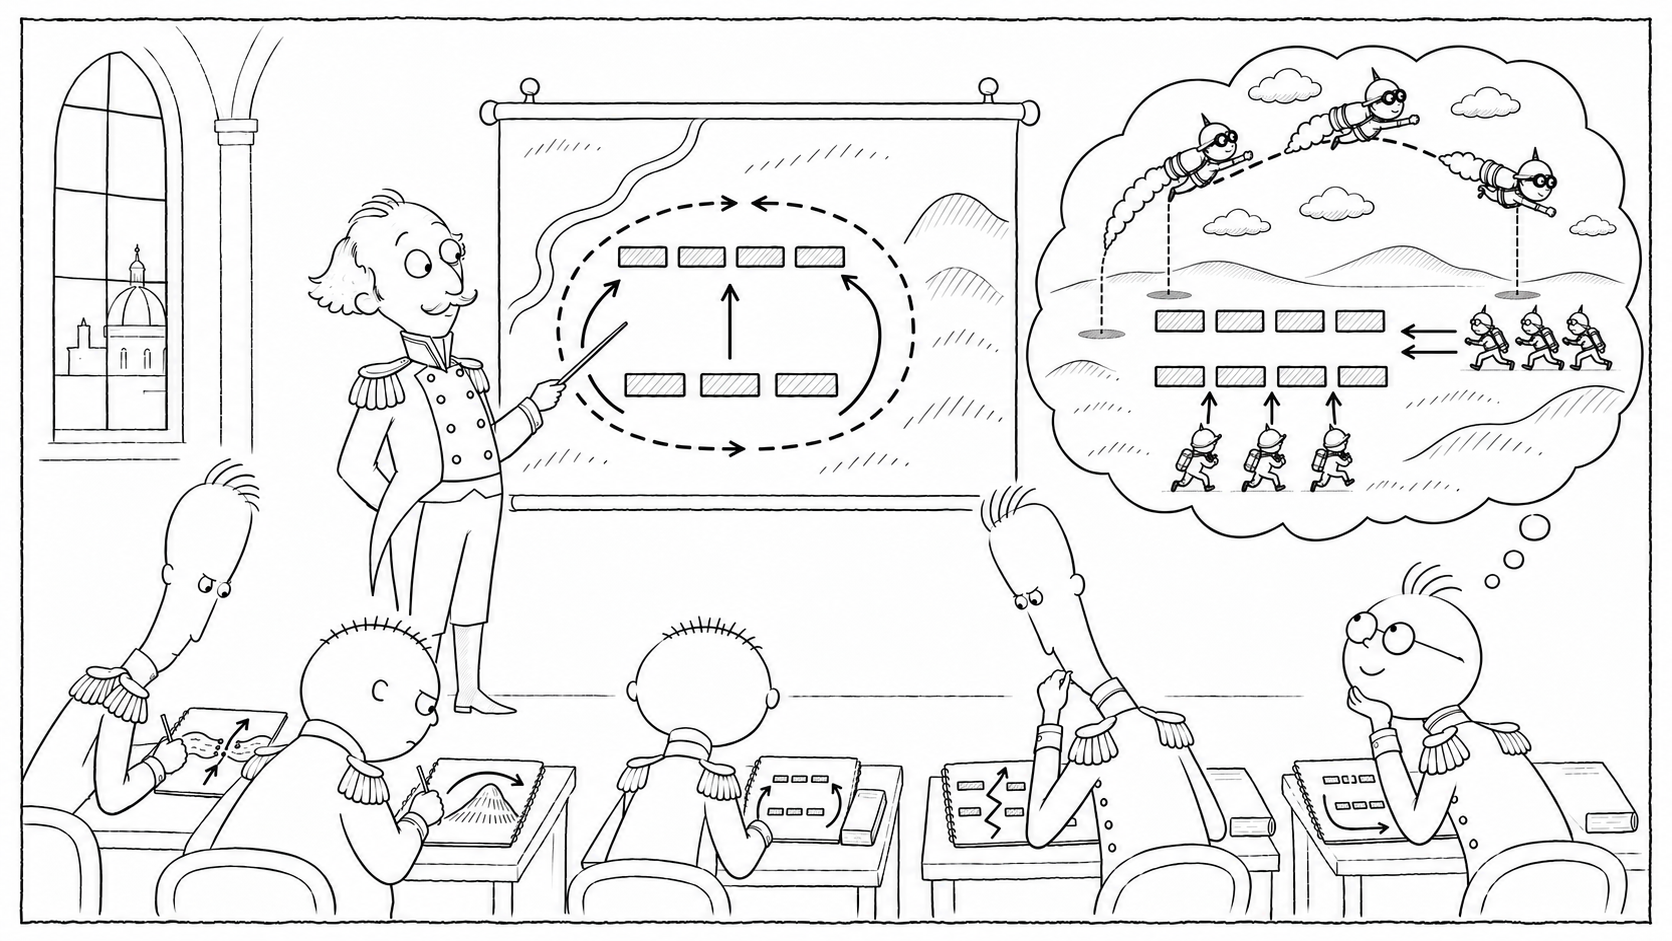
However, these discussions share an underlying assumption: the question we should be investigating has already been determined. For example, if the objective is to identify genes with different mean expression levels between two groups, the discussion focuses on selecting the most appropriate statistical model and thresholds for that purpose. This is like comparing different routes to the summit of the same mountain. But what if we should be climbing a different mountain altogether?
What If We Should Be Climbing a Different Mountain?
In The Future of Data Analysis (1962), statistician John Tukey expressed the idea that an approximate answer to the right question can be more valuable than an exact answer to the wrong question. I believe this perspective is equally relevant to data analysis in the life sciences.
For example, suppose we are comparing patients with a particular disease against healthy controls to identify genes with different mean expression levels. However, closer examination of the data might reveal that only a subset of patients shows substantial changes. In that case, is comparing the mean expression levels of the entire patient group really the best way to capture the biologically important phenomenon? Alternatively, mean expression levels might be similar between groups, while gene expression variability is markedly greater among patients. Such a pattern could reflect changes in biological regulation. Of course, observing these features does not immediately reveal their biological causes. Nevertheless, they may prompt us to question whether the originally planned DEG analysis is sufficient. For such data, endlessly debating whether DESeq2 or edgeR is superior may never resolve the fundamental problem.
Taking a Step Back to See the Bigger Picture
I therefore recommend stepping back from individual analytical decisions and reconsidering the overall analysis from the perspective of the research objective.
Based on our research objectives and experimental designs, we tend to assume that a dataset should have certain characteristics and that a particular analytical method will therefore be appropriate. We may also develop preconceptions from the standard workflows we have learned, assuming that a particular type of data must be analyzed in a particular way. However, following these assumptions without questioning them may cause us to overlook unexpected features in the actual data. Even when a standard workflow is executed correctly, the resulting analysis is not necessarily appropriate for the research objective.
Therefore, before deciding, "This is the kind of data I have, so this is how I should analyze it," we should ask: "This is what I expect the data to look like, but is that what I actually observe?" One effective way to answer this question is to visualize the data from multiple perspectives and examine what is actually there.
What You See Inspires You.
What We Learned from Galaxy to iDEP: Visualization Is Not the Same as Verifiability
We have examined the same RNA-Seq dataset (GSE173789) using several analysis environments, including Subio Platform, Galaxy, RaNA-Seq, RNAseqChef, and iDEP. Our earlier reanalysis using Subio Platform had already shown that distortions in gene expression distributions in some samples substantially affected DEG identification. In this series of case studies, we focused on whether users of other analysis tools could recognize these characteristics of the data and their effects on the results.
These tools provide a variety of analytical and visualization functions. They can generate PCA plots, heatmaps, and other graphs, some of which reveal signs of unexpected features in the data. However, through hands-on testing, we found that providing visualization functions is not necessarily the same as allowing users to investigate the characteristics of the data in detail.
Even when a graph reveals something suspicious, a single graph is usually insufficient to determine whether it represents a genuine problem. We may need to identify particular samples and examine them in other graphs, compare their characteristics with experimental conditions, or change the samples included in an analysis and compare the results. Recognizing a potentially problematic pattern does not necessarily mean that enough information is available to determine whether it is actually a problem.
This is not simply a matter of having too few types of visualizations. Even when software can generate many different graphs, investigating the data from multiple perspectives and comparing different sources of information becomes extremely difficult if those graphs exist only as independent images.
Being able to visualize data is not the same as being able to critically assess the validity of analysis results. This was one of the most important findings from our series of case studies.
What Kind of Visualization Is Needed to Critically Evaluate Data?
Through these case studies, we came to recognize the importance of at least three capabilities.
1. Connecting Multiple Visualizations
It is important to examine features observed in one graph from multiple perspectives using other graphs, so that we can determine whether they represent meaningful characteristics of the data or possible sources of problems.
For example, when a sample appears in an unexpected position in a PCA plot, we need to investigate which gene expression patterns contribute to its separation from the other samples. This requires multiple visualizations, such as heatmaps, scatter plots, line graphs, and histograms. We also need to examine the data at different processing stages, including raw counts, normalized counts, and the actual values used in each analysis.
In other words, multiple visualizations need to be linked together rather than treated as independent graphs.
2. Interactive Exploration
Users need to be able to freely investigate their observations by changing the genes and samples being analyzed, as well as the display settings.
For example, we might mark a sample that appears separated from the others in a PCA plot, examine where that sample appears in a heatmap, investigate which gene expression patterns contribute to its unusual position, compare the raw and normalized counts of those genes, and then ask whether the observed expression pattern might have been created by normalization. We need to be able to investigate this sequence of questions immediately, as each new question arises.
The key is to let researchers explore the data seamlessly as their thinking evolves, without repeatedly modifying and reimporting data files whenever they change the analysis settings.
3. Integrating Information Beyond Experimental Measurements
Gene expression measurements alone may not provide enough information to determine what observed differences mean. Making such judgments requires examining the data in conjunction with experimental conditions, clinical information, sample attributes, gene annotations, and other associated information.
For example, when PCA reveals an unexpected group of samples, we may want to examine whether that grouping corresponds to age, sex, treatment history, sampling conditions, experimental dates, or personnel involved in the experiments. Such relationships may suggest new biological hypotheses or raise suspicions of technical factors such as batch effects.
Here again, it is not enough for associated information merely to be stored somewhere and retrievable when needed. As questions arise during data exploration, users should be able to connect the relevant information immediately and investigate the data from different perspectives.
What is needed to critically evaluate data is not merely the ability to generate many different types of graphs, but the ability to connect multiple visualizations and associated information, allowing users to explore and verify their observations freely as their thinking develops.
Why the Third Capability Becomes Even More Important in the AI Era
The widespread adoption of AI is transforming both bioinformatics education and the environment in which data analysis is performed. AI can explain statistical methods and algorithms, assist with writing analysis code, and help resolve errors. It will also become increasingly easy to provide a dataset and have AI execute an entire analytical workflow automatically.
This brings us back to the educational question raised at the beginning. Even if AI makes it easier to acquire knowledge and execute analyses, the question of whether the results are appropriate for the research objective remains. In particular, we must remember that standard analytical workflows are not necessarily suitable for the data in front of us. Indeed, as AI takes over more of the practical work of data analysis, there is growing concern that researchers may complete analyses without adequately examining the validity and consistency of the results. Related risks are discussed in Ten Simple Rules for Responsible Use of AI and LLMs in Computational Biology.
This is why I believe a third perspective on bioinformatics education will become increasingly important in the AI era. How can we develop not only the ability to perform analyses, but also the ability to examine the results, raise questions, and reconsider the analytical approach itself when necessary? This is a challenge worth addressing in the future of bioinformatics education.
Developing the Ability to Critically Evaluate Analysis Results
Finally, I would like to clarify the role of Subio Platform in this context.
There is no need to perform the analyses reported in scientific papers using Subio Platform. Researchers are free to use R, Python, Galaxy, or any other analysis tools. They should choose the methods best suited to their research objectives.
However, regardless of which tools are used, researchers need to investigate the characteristics of the original data, examine how analytical choices affect the results, and determine whether results from different analyses are mutually consistent. Subio Platform is designed to help researchers perform this kind of exploratory data analysis (EDA) and verification themselves.
We therefore suggest using Subio Platform both before and after an analysis to examine the data and results from a broader perspective. Before the analysis, it can help researchers examine the data as they are and decide on an appropriate analytical approach. Afterward, it can help them verify the validity and consistency of the results.
Ultimately, it is researchers themselves who must recognize important features in the data, formulate hypotheses, test them, and make informed judgments. We hope you will find Subio Platform useful in teaching and developing these essential skills.
Series: Can RNA-Seq Analysis Tools Help Identify Problems in Data?
This series examines whether different analysis tools can help users identify problems in the same RNA-Seq dataset (GSE173789), investigate their causes, and evaluate their effects on analysis results.
- Identifying Problems Through Data Visualization — Investigating distorted expression distributions and their effects on analysis results
- RNA-Seq Analysis Using a Standard Galaxy Workflow — Analysis and verification using a standard workflow
- Trying RaNA-Seq — Automated analysis from FASTQ files and verification of the results
- Trying RNAseqChef — Extensive analysis functions and exploratory verification
- Trying iDEP — Can its extensive QC visualizations help identify problems in data?
- A Third Perspective on Bioinformatics Education — The importance of critically evaluating analysis results in the AI era