Enrichment analysis is a method for examining the relationships between a selected gene list and existing biological knowledge. Gene Ontology (GO) terms and pathways are commonly used, but enrichment analysis can also be performed using various other gene sets, such as chromosomal regions, protein domains, and targets of miRNAs or transcription factors.
There are two ways to perform enrichment analysis with Subio Platform: using a free web-based tool or using the Enrichment Analysis Tool in the Advanced Plug-in.
Method 1: Use a Free Web-Based Tool
Free web-based tools such as DAVID Functional Annotation can be used for enrichment analysis. By submitting gene lists extracted in Subio Platform to these tools, you can identify associated GO terms, pathways, and other annotations.
For a practical example using DAVID, see Section 7, "Gene Annotation and Enrichment Analysis," of the RNA-Seq Analysis Tutorial .
Method 2: Use the Enrichment Analysis Tool in the Advanced Plug-in
The Advanced Plug-in for Subio Platform includes the Enrichment Analysis Tool. A key feature of this tool is that it allows you to identify Gene Sets associated with the Target, compare two Targets, and then examine the expression patterns of individual genes. When you select Measurements from the results table and click Preview, they are linked to the graphs in the main Subio Platform window. You can also use the Venn Diagram tool to distinguish genes shared by the two Targets from those unique to either Target and investigate them in more detail.
Example: Comparing Two Targets
The Enrichment Analysis Tool allows you to analyze two Measurement Lists using the same Background, Gene Set definitions, and statistical test, and compare the results side by side.
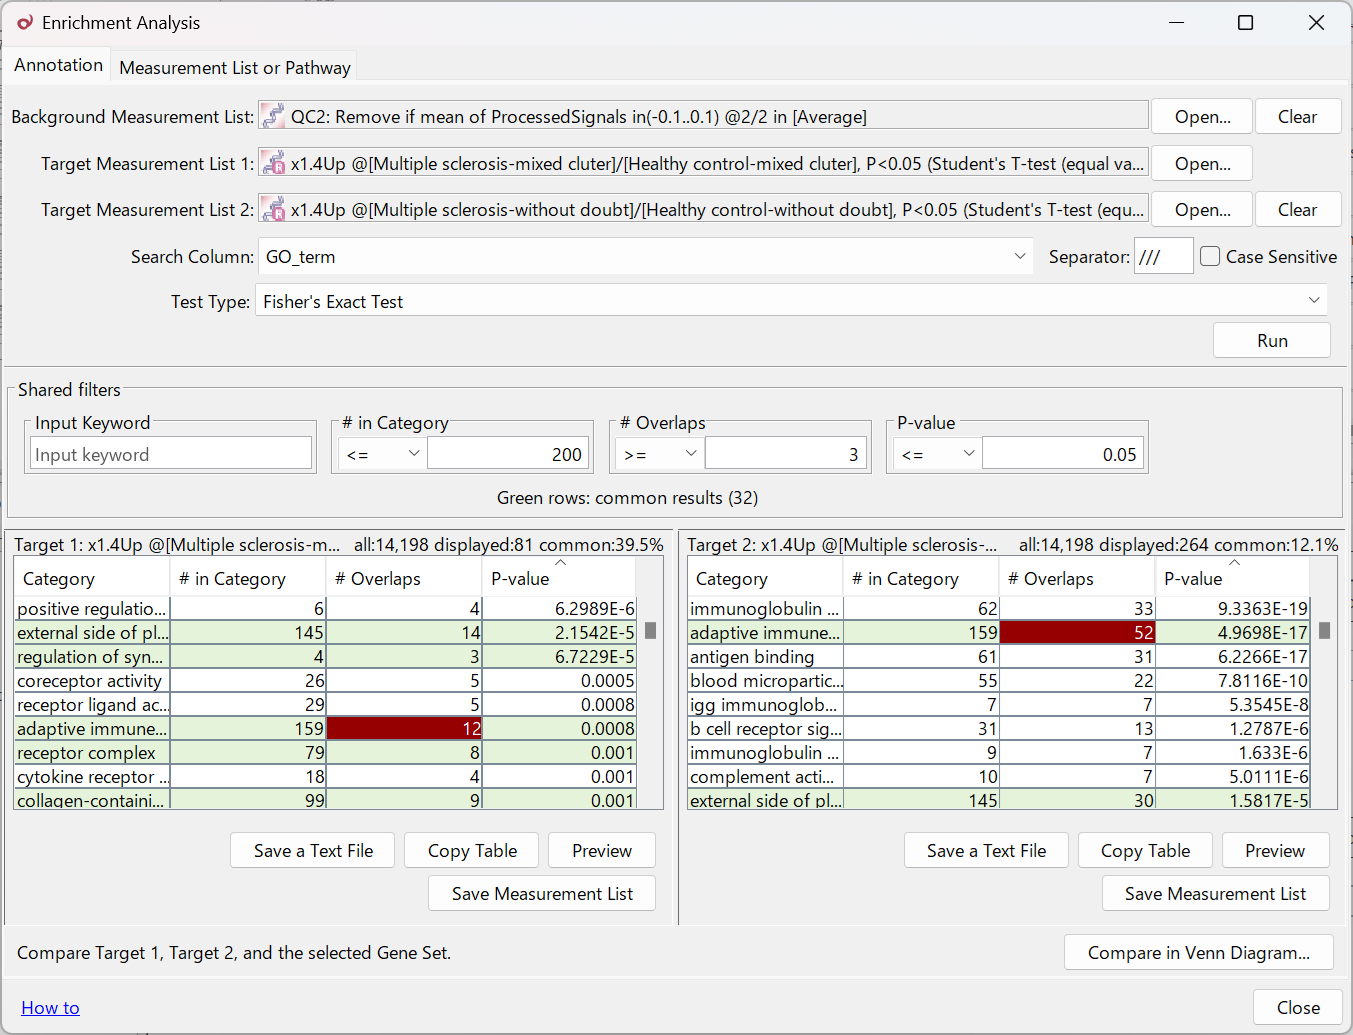
For example, you can use this feature for the following comparisons:
- Different biological conditions: Compare gene lists extracted under different conditions, such as Treatment A versus Treatment B or Disease A versus Disease B.
- Different datasets: Compare gene lists from similar studies obtained from GEO or other sources, such as the UP list from Series 1 and the UP list from Series 2. You can identify Gene Sets shared across studies or detected in only one dataset.
- Different analysis settings or thresholds: Compare gene lists generated using different selection criteria, such as P-value thresholds of 0.05 versus 0.01, P-value versus FDR, or fold-change thresholds of 1.5 versus 2.0. This allows you to examine how enrichment results change when the gene selection criteria are modified.
- Assessing the impact of sample selection: If unexpected patterns are found in expression data, compare an UP list obtained using all samples with an UP list obtained after excluding a particular group of samples. This can help assess how much the results are affected by sample selection, especially when batch effects or other sources of variation are suspected.
Thus, comparing two Targets is useful not only for investigating biological differences, but also for evaluating how analysis settings and sample selection affect the results.
1. Set Up the Targets and Background
Specify the Measurement Lists to use in the analysis. You can drag and drop Measurement Lists or select them using Open....
- Background Measurement List: Defines the background population for the analysis. If no list is specified, All Measurements is used. If the Target lists were selected from Measurements that passed quality control, using the corresponding QC list as the Background is generally more appropriate.
- Target Measurement List 1: The Measurement List to be analyzed for enrichment, such as a list of differentially expressed genes (DEGs). If you only want to analyze one list, you can run the analysis using this Target alone.
- Target Measurement List 2: An optional second Measurement List for enrichment analysis. When both Targets are specified, their results can be compared side by side.
2. Choose How to Define Gene Sets
Gene Sets used for enrichment analysis can be defined in two ways:
| Tab | Gene Set Definition |
|---|---|
| Annotation | Select an annotation column and use the Measurements associated with each term as a Gene Set. This is useful for GO terms and similar annotations. |
| Measurement List or Pathway | Select a folder containing Measurement Lists or Pathways and use the sets in that folder as Gene Sets. You can use custom Gene Sets as well as Gene Sets obtained from resources such as MSigDB, which is used in GSEA. |
3. Run Enrichment Analysis
When using the Annotation tab, select the gene annotation column to analyze, such as a GO term column, under Search Column. If a cell contains multiple terms, set the appropriate Separator to match the format of the data.
Under Test Type, select Fisher's Exact Test or Chi-Square Test, then click Run.
4. Compare the Results of Two Targets
The results tables show the Gene Set name, the number of Measurements in the Gene Set, the number overlapping with the Target, the P-value, and other information. By default, results are sorted by ascending P-value.
The results are filtered using Shared filters, but you can change the filter settings as needed. You can also narrow down the results by entering keywords in the Input Keyword field.
Gene Sets that pass the shared filters for both Targets are highlighted in green. At the top-right of each results table, you can see the number of shared Gene Sets and the percentage they represent among the displayed results for that Target.
When you select a Gene Set in one results table, the corresponding Gene Set is also selected in the other table, if it is displayed there. This allows you to compare Gene Sets found in both Targets with those found in only one Target.
When you hover over a green row, the tool displays the number and percentage of genes that overlap with one Target and are also included in the other Target, for that Gene Set.
5. Examine Genes Using Preview
Select a cell in the results table and click Preview to link the corresponding Measurements to the main Subio Platform window. You can visually examine their expression patterns, see which clusters they belong to in a heatmap, and check whether their chromosomal positions show any bias, using various graphs.
Use Save Measurement List to save the selected Measurements as a new Measurement List.
6. Examine Shared and Unique Genes Using Venn Diagram
Select a Gene Set and click Compare in Venn Diagram... to display Target Measurement List 1, Target Measurement List 2, and the selected Gene Set (within the Background) in a Venn Diagram.
This allows you to determine whether the same Gene Set appears enriched in both Targets because they share many of the same genes, or because different genes from each Target belong to that Gene Set.
You can also get an initial indication of this overlap by hovering over the green rows, as described above. Use this information to select Gene Sets of interest, then investigate them in more detail using Venn Diagram.
In addition, Venn Diagram allows you to extract genes that belong to the Gene Set but are not included in either Target, as well as genes included in only Target 1 or Target 2.
By examining these genes with Preview, you can investigate whether they narrowly missed the DEG selection threshold, show genuinely different expression patterns, or whether variability among samples influenced their classification.
For detailed instructions on using Venn Diagram, see How to Use the Venn Diagram Tool .
7. Save the Results
You can save or copy the analysis results using the following options:
- Save a Text File: Saves the results table as a text file.
- Copy Table: Copies the results table to the clipboard. You can paste it into Excel or another application to organize and save results from multiple analyses.
- Save Measurement List: Saves the selected Gene Set or the genes shared with a Target as a Measurement List.
Limitations of Enrichment Analysis and Interpretation of Results
Enrichment analysis relies on existing knowledge about gene functions and biological pathways. Therefore, its results depend on the information available in the databases being used.
The results and their biological interpretation also depend on which genes are included in the input list.
Even if a statistically significant Gene Set is identified, this alone does not demonstrate that the corresponding biological function is actually activated or that it causes the observed phenomenon.
Enrichment analysis is a way to generate hypotheses and obtain clues for interpreting research findings.
Rather than drawing conclusions solely from the names of enriched GO terms or pathways, it is important to examine which genes contribute to the results and what expression patterns those genes show.
The Enrichment Analysis Tool in the Advanced Plug-in allows you to move from Gene Set analysis to visualization of individual genes within the same environment.
For more information about selecting gene lists for enrichment analysis, see Getting Meaningful Results from Enrichment Analysis: Are You Using the Right Gene List? .
For a discussion of what GO and pathway analyses can reveal, and how far they can help explain the causes of observed biological phenomena, see Can GO and Pathway Analysis Identify the Cause? .