Differentially expressed genes (DEGs) are often expected to show consistently high expression in one condition and low expression in another, as illustrated by the single-factor model below. However, this expectation may be unrealistic for complex biological phenomena. The following simplified models illustrate how genes involved in disease mechanisms may exhibit very different expression patterns.
1 Parameter
Model 1: Single Factor Model
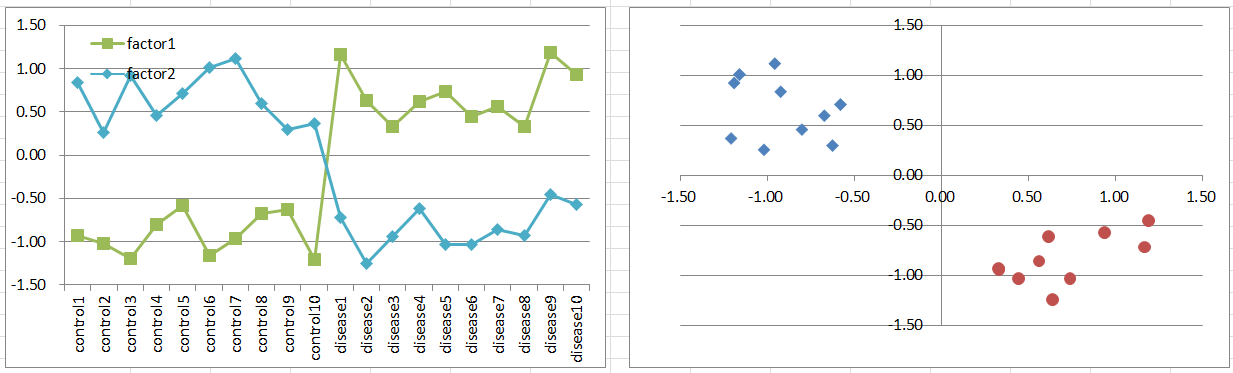
Suppose a disease develops when the expression level of a single causal gene is either unusually high or unusually low. This represents the typical expression pattern we might expect from a DEG, but such a simple mechanism may be uncommon in reality.
Control and diseased samples can be separated along a single dimension representing the expression level of that gene.
2 Parameters
Model 2: Two Factors Model
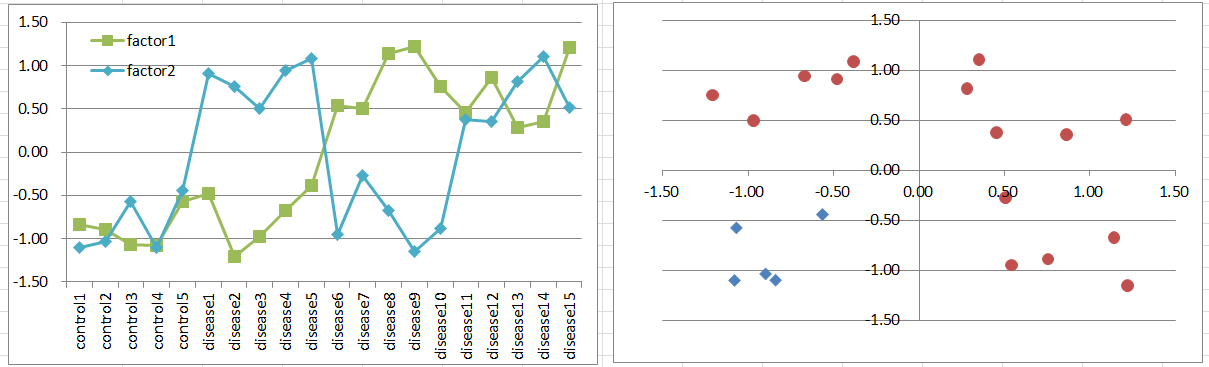
Suppose a disease develops when either of two factors is highly expressed. These factors might be homologous genes or components of different signaling pathways. If all combinations of factor states are equally frequent, diseased samples will outnumber controls, although real datasets may not follow this distribution.
Expression levels may show a bimodal distribution among diseased samples, potentially violating the normality assumption of a t-test. Nevertheless, the causal genes may still be identified with relatively small p-values.
Diseased samples occupy three quadrants of the two-dimensional coordinate plane, while controls occupy the remaining quadrant.
Model 3: Co-factors Model
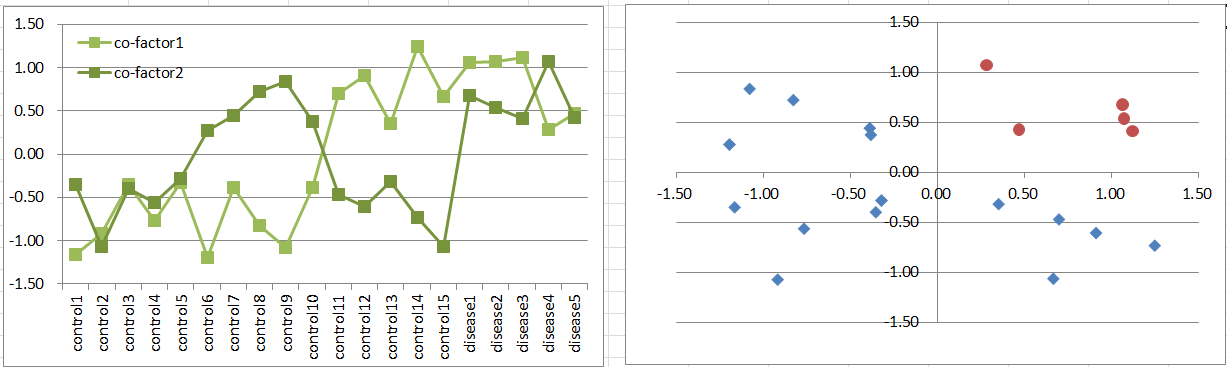
Suppose a disease develops only when both co-factors are highly expressed. This represents a simple but biologically plausible mechanism.
Although the expression patterns resemble those in Model 2, diseased samples are less frequent. The distribution of expression levels may again violate the assumptions of a t-test, but the co-factors may still be detected as DEGs.
Diseased samples occupy only one quadrant of the two-dimensional coordinate plane.
Model 4: Factor + Inhibitor Model
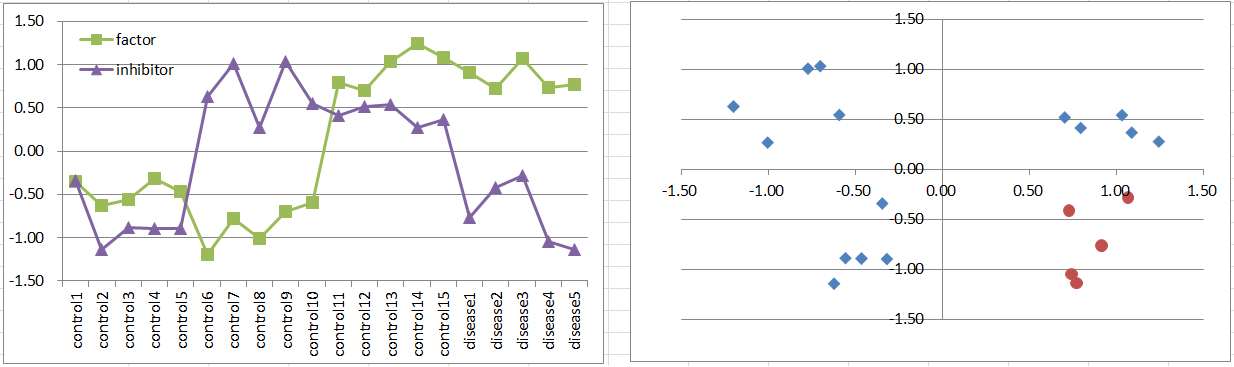
Suppose a disease develops when a factor is highly expressed, unless an inhibitor is also expressed. This is another simple but biologically plausible mechanism.
This model resembles Model 3 in both the frequency and spatial distribution of diseased samples.
Model 5: Two Balancers Model
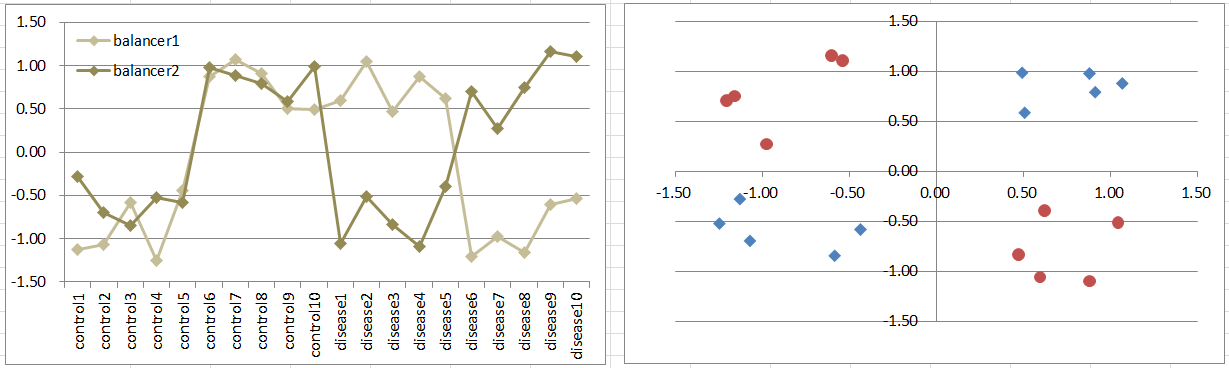
Suppose a disease develops when the expression levels of two genes become unbalanced, regardless of their absolute levels. Imagine two signals continuously entering a pathway and normally maintaining a balance. Disrupting that balance causes the system to deviate from its normal state. This provides a simple model of biological regulation.
Diseased samples occupy two diagonally opposite quadrants. Such genes can be difficult to detect using a t-test because their mean expression levels may not differ between conditions. Nevertheless, simulated t-test p-values can sometimes fall below 0.05. Download the Excel file to examine the simulated p-values.
Models 2–5 differ in the frequency and spatial distribution of diseased samples. The following models extend these concepts to three parameters.
3 Parameters
Model 6: Two Factors + Inhibitor Model
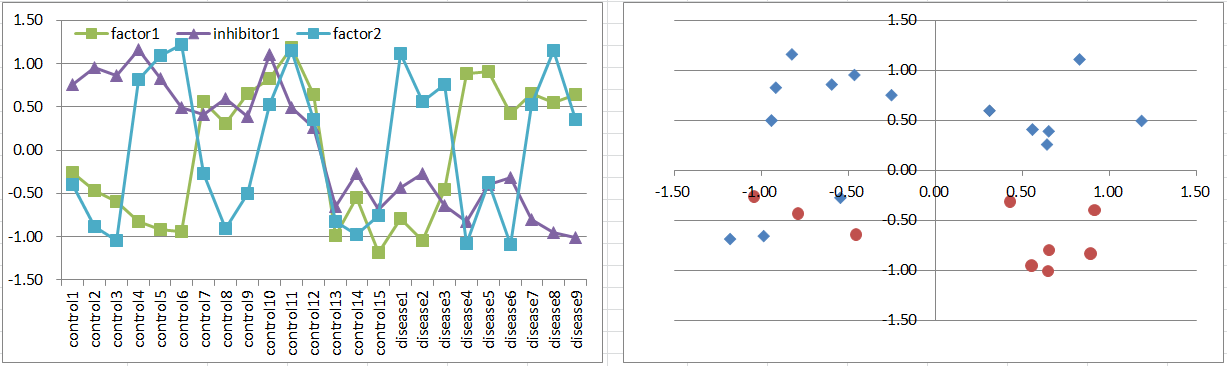
Suppose a disease develops when either of two factors is highly expressed, unless an inhibitor is also expressed.
The causal factors may be more difficult to identify through statistical testing, while the inhibitor may be easier to detect.
Diseased samples occupy three octants of the three-dimensional coordinate space.
Model 7: Factor + Co-inhibitors Model
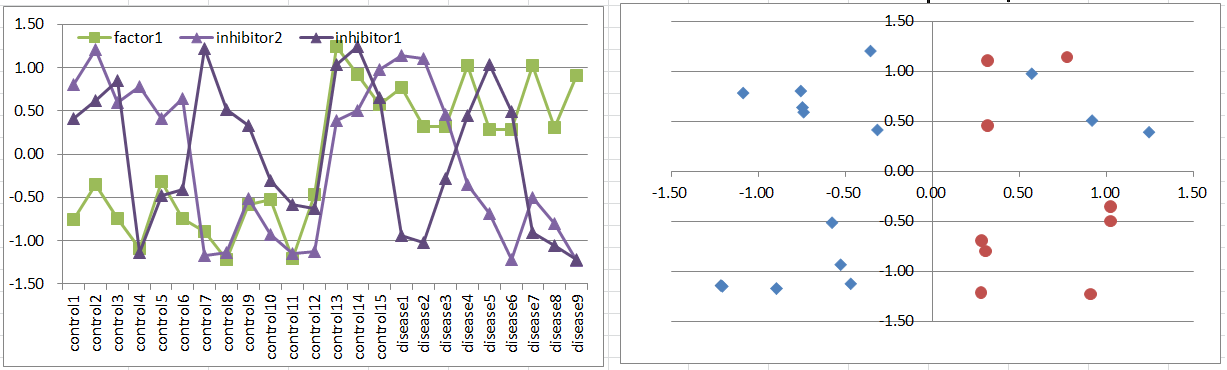
Suppose a disease develops when a factor is highly expressed, unless both co-inhibitors are also expressed.
Notice how closely this expression pattern resembles that of Model 6.
Model 8: Co-factors + Inhibitor Model
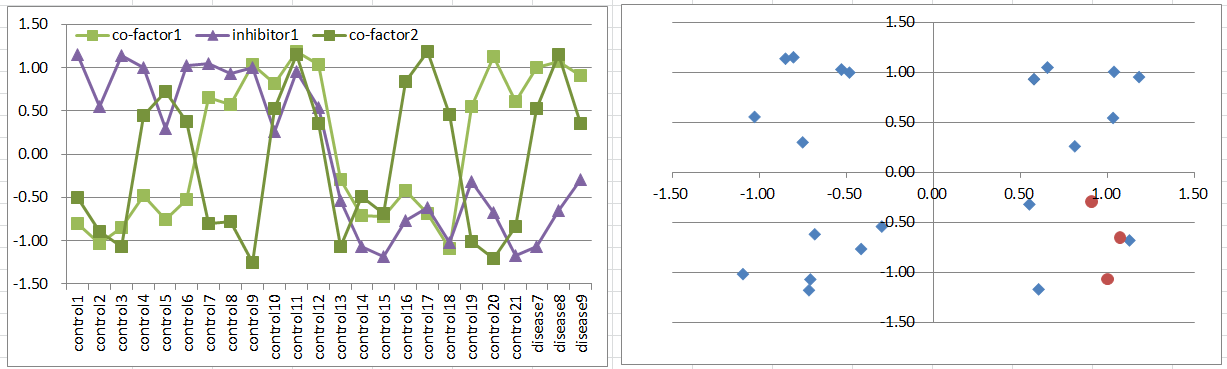
Suppose a disease develops when both co-factors are highly expressed, unless an inhibitor is also expressed.
Assuming all combinations of factor states are equally frequent, diseased samples are much less common than in Models 6 and 7. They occupy only one octant of the three-dimensional coordinate space.
Model 9: Factor + Two Inhibitors Model
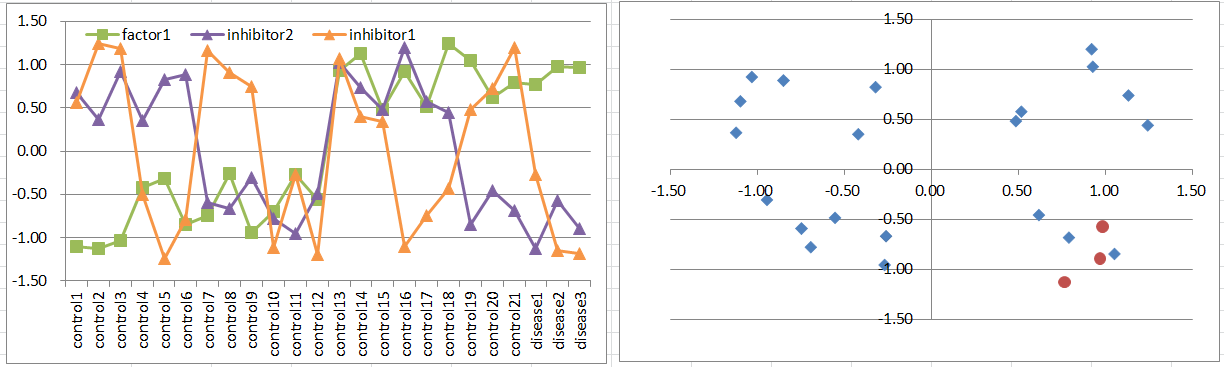
Suppose a disease develops when a factor is highly expressed, unless either of two inhibitors is also expressed.
This expression pattern closely resembles that of Model 8.
Model 10: Three Balancers Model
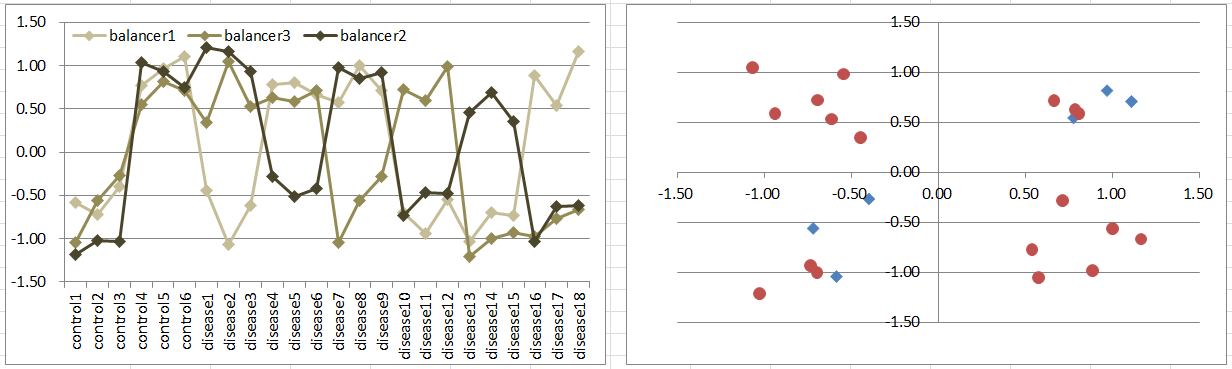
Suppose a disease develops when the expression level of one of three genes differs from those of the other two, regardless of their absolute levels.
This model resembles Model 5, but control samples occupy two diagonally opposite octants of the three-dimensional coordinate space.
Conclusion
DEG analysis aims to identify genes with statistically significant expression changes while controlling false positives. However, selecting genes with statistically significant expression changes is not necessarily the same as selecting genes that fit a biological hypothesis. Even in the simplified models examined here, causal genes often do not exhibit typical DEG expression patterns.
This suggests that a simple t-test could be useful for a different purpose. Rather than prioritizing genes with extremely small p-values, we could deliberately select genes with p-values near the significance threshold (e.g., 0.05–0.15) and use clustering to explore distinctive expression patterns. The goal is not to enrich the candidate set for statistically significant genes, but to increase the proportion of genes that fit a biological hypothesis.
However, different underlying mechanisms can produce similar expression patterns, as illustrated by Models 3 and 4, 6 and 7, 8 and 9, and 5 and 10. In other words, there may be fewer observable expression patterns than underlying disease mechanisms. We therefore cannot infer a specific mechanism directly from an observed expression pattern. Nevertheless, it may be worth considering whether the resulting clusters might represent causal factors, inhibitors, or co-factors, and exploring the possible mechanisms suggested by their combinations.