You might believe you must use TPM/FPKM/RPKM, not read counts, to avoid systematic bias among samples. But normalizing per million reads is a kind of "global normalization" that can theoretically cancel only the linear systematic error. However, such an assumption is too naïve for omics data analysis. Especially transcriptomics of large patient sets need careful examination because they will likely have quality issues.
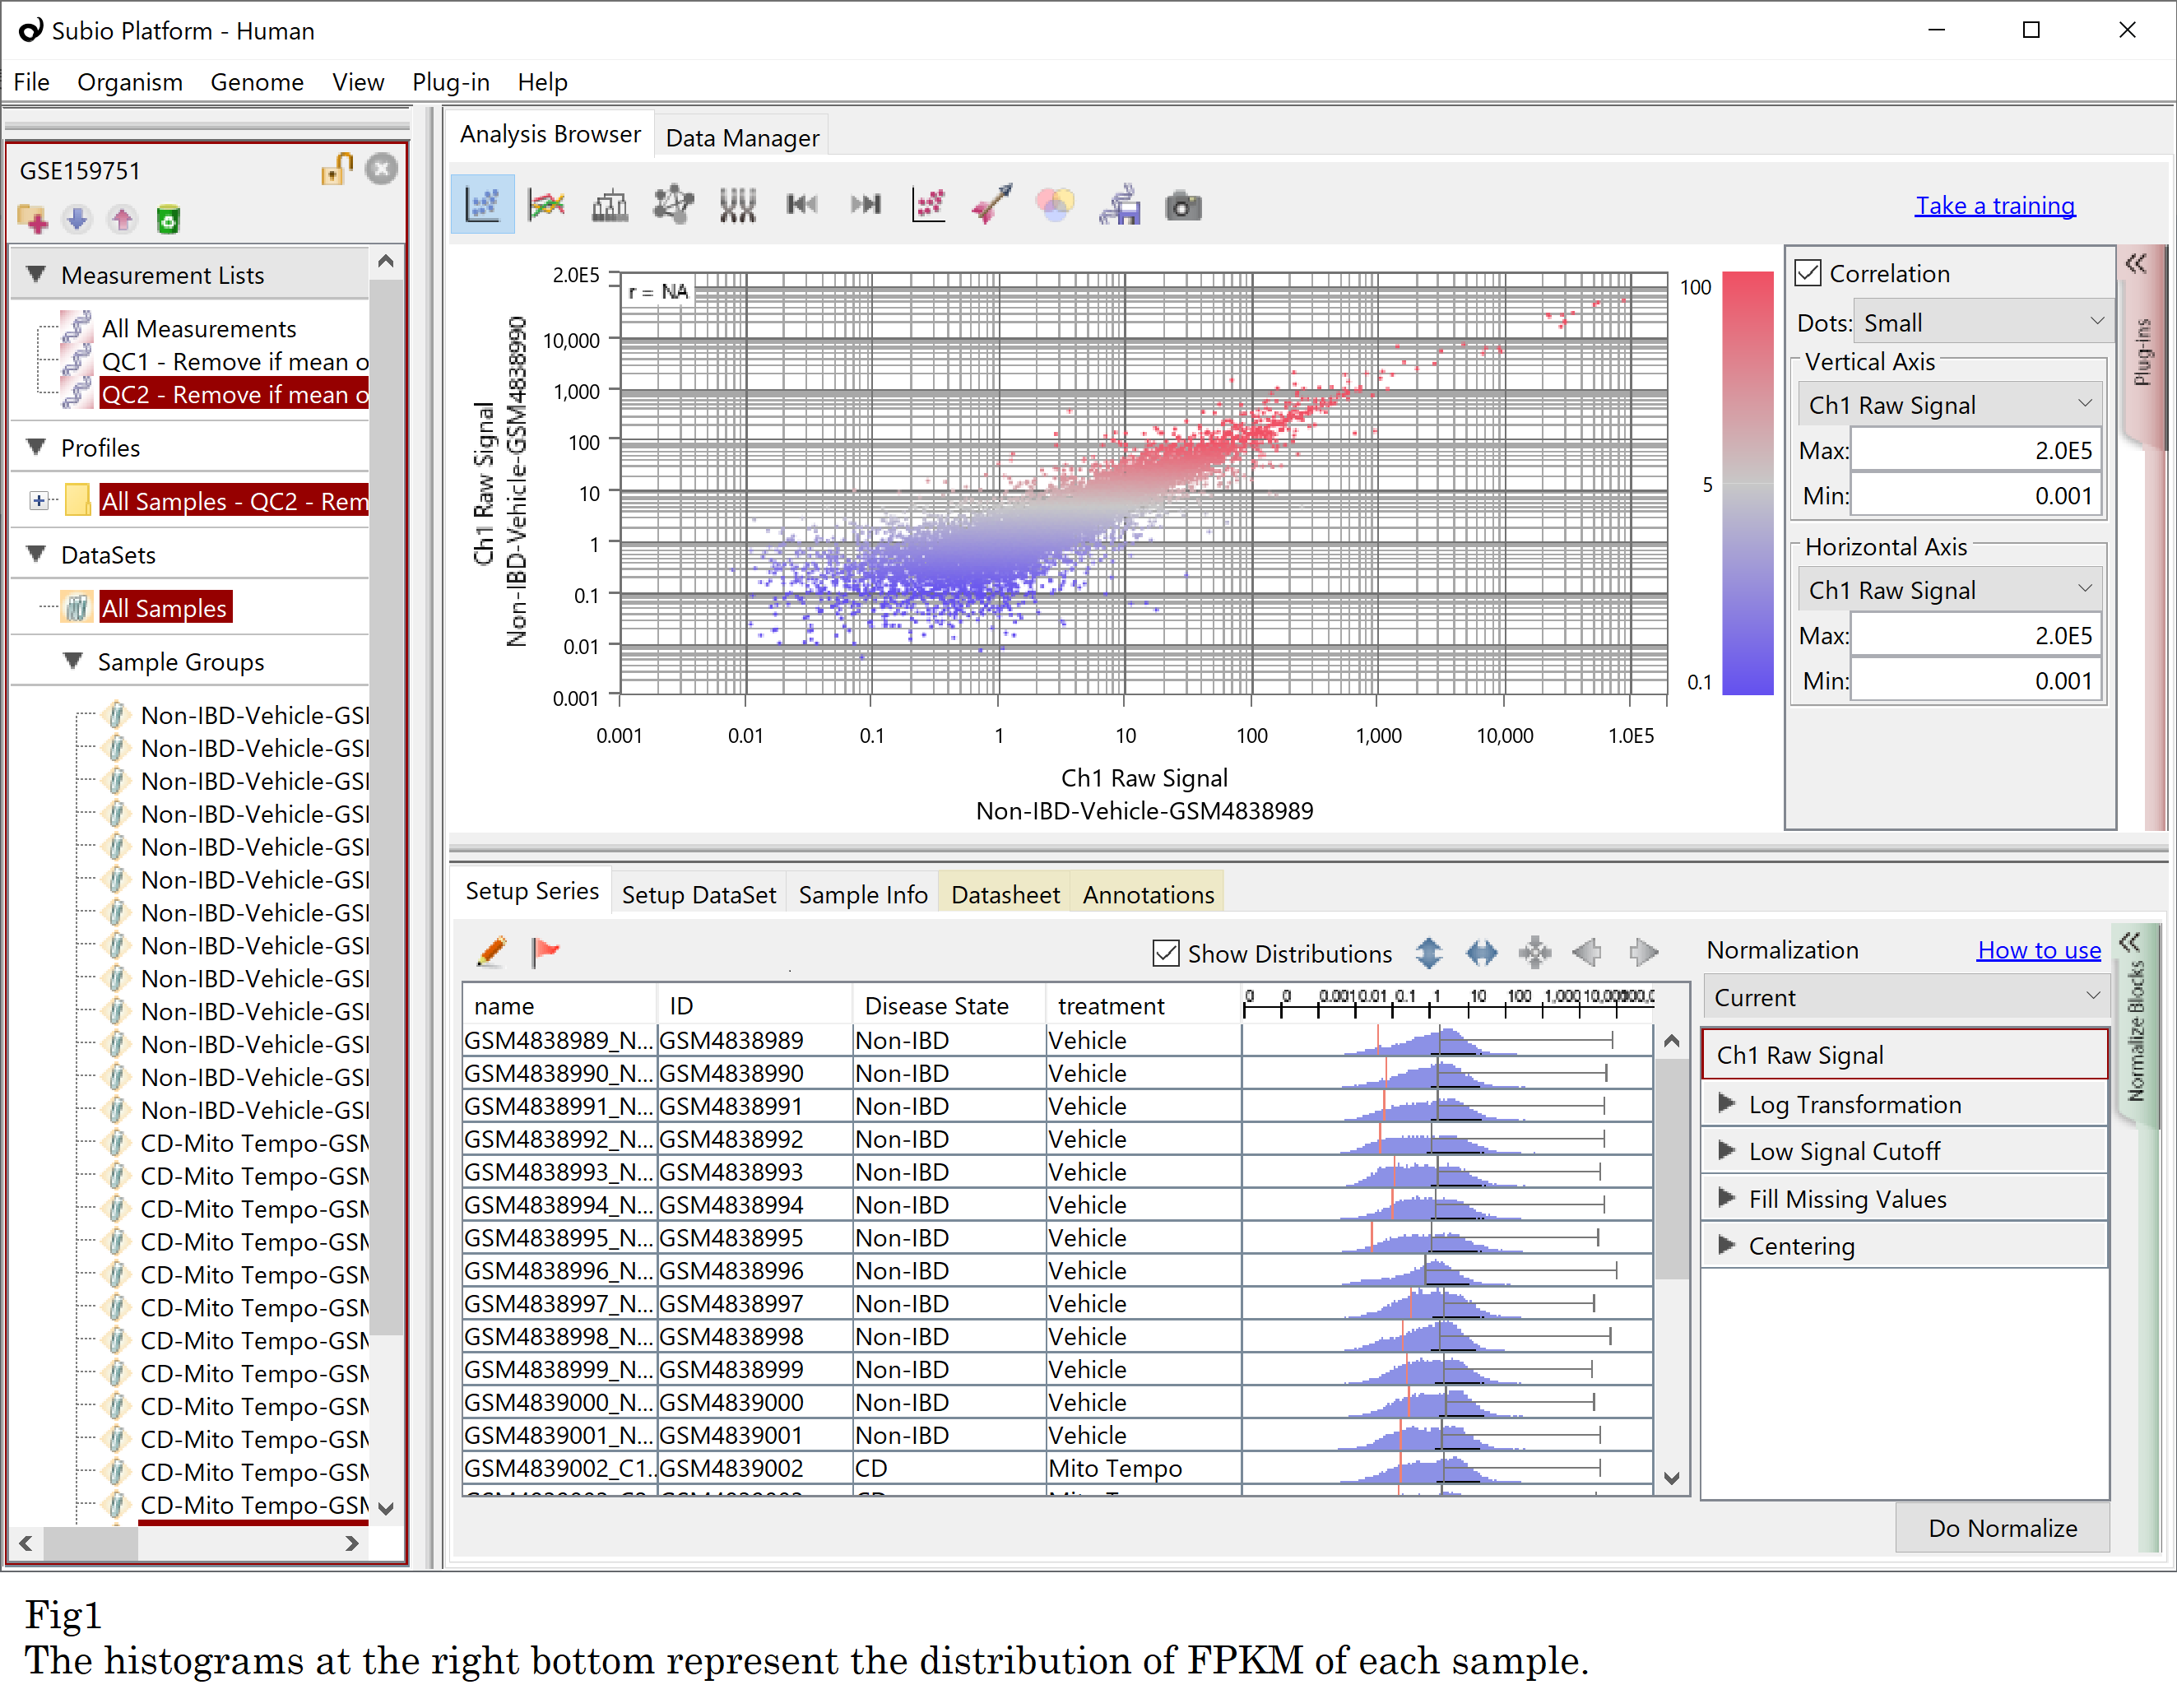
Let’s see an example, GSE159751 , which is composed of 26 samples in two groups. GSE159751_RAW.tar seems to contain FPKM values according to the GSM records . Please notice that the distribution patterns of FPKM represented by histograms vary. There seem to be two types of shapes: monomodal and bimodal-like, regardless of the disease state. It strongly indicates there is a systematic error. (Fig1)
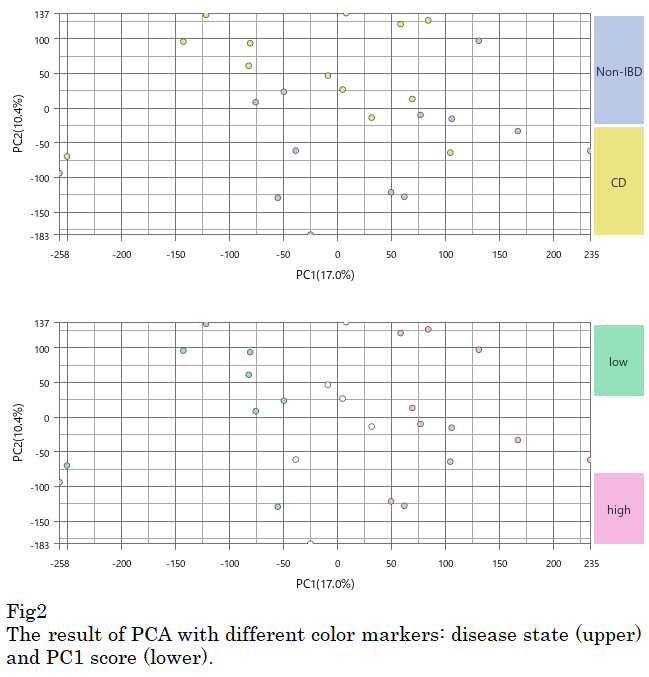
Subsequently, the expression profiles are likely clustering together by the non-linear bias, not by biological context. Please look at the result of PCA, the disease state (blue and yellow) is not associated with the PC1 (horizontal axis). (Fig2, upper) So I marked samples as PC1 score high and low (pink and green). (Fig2, lower)
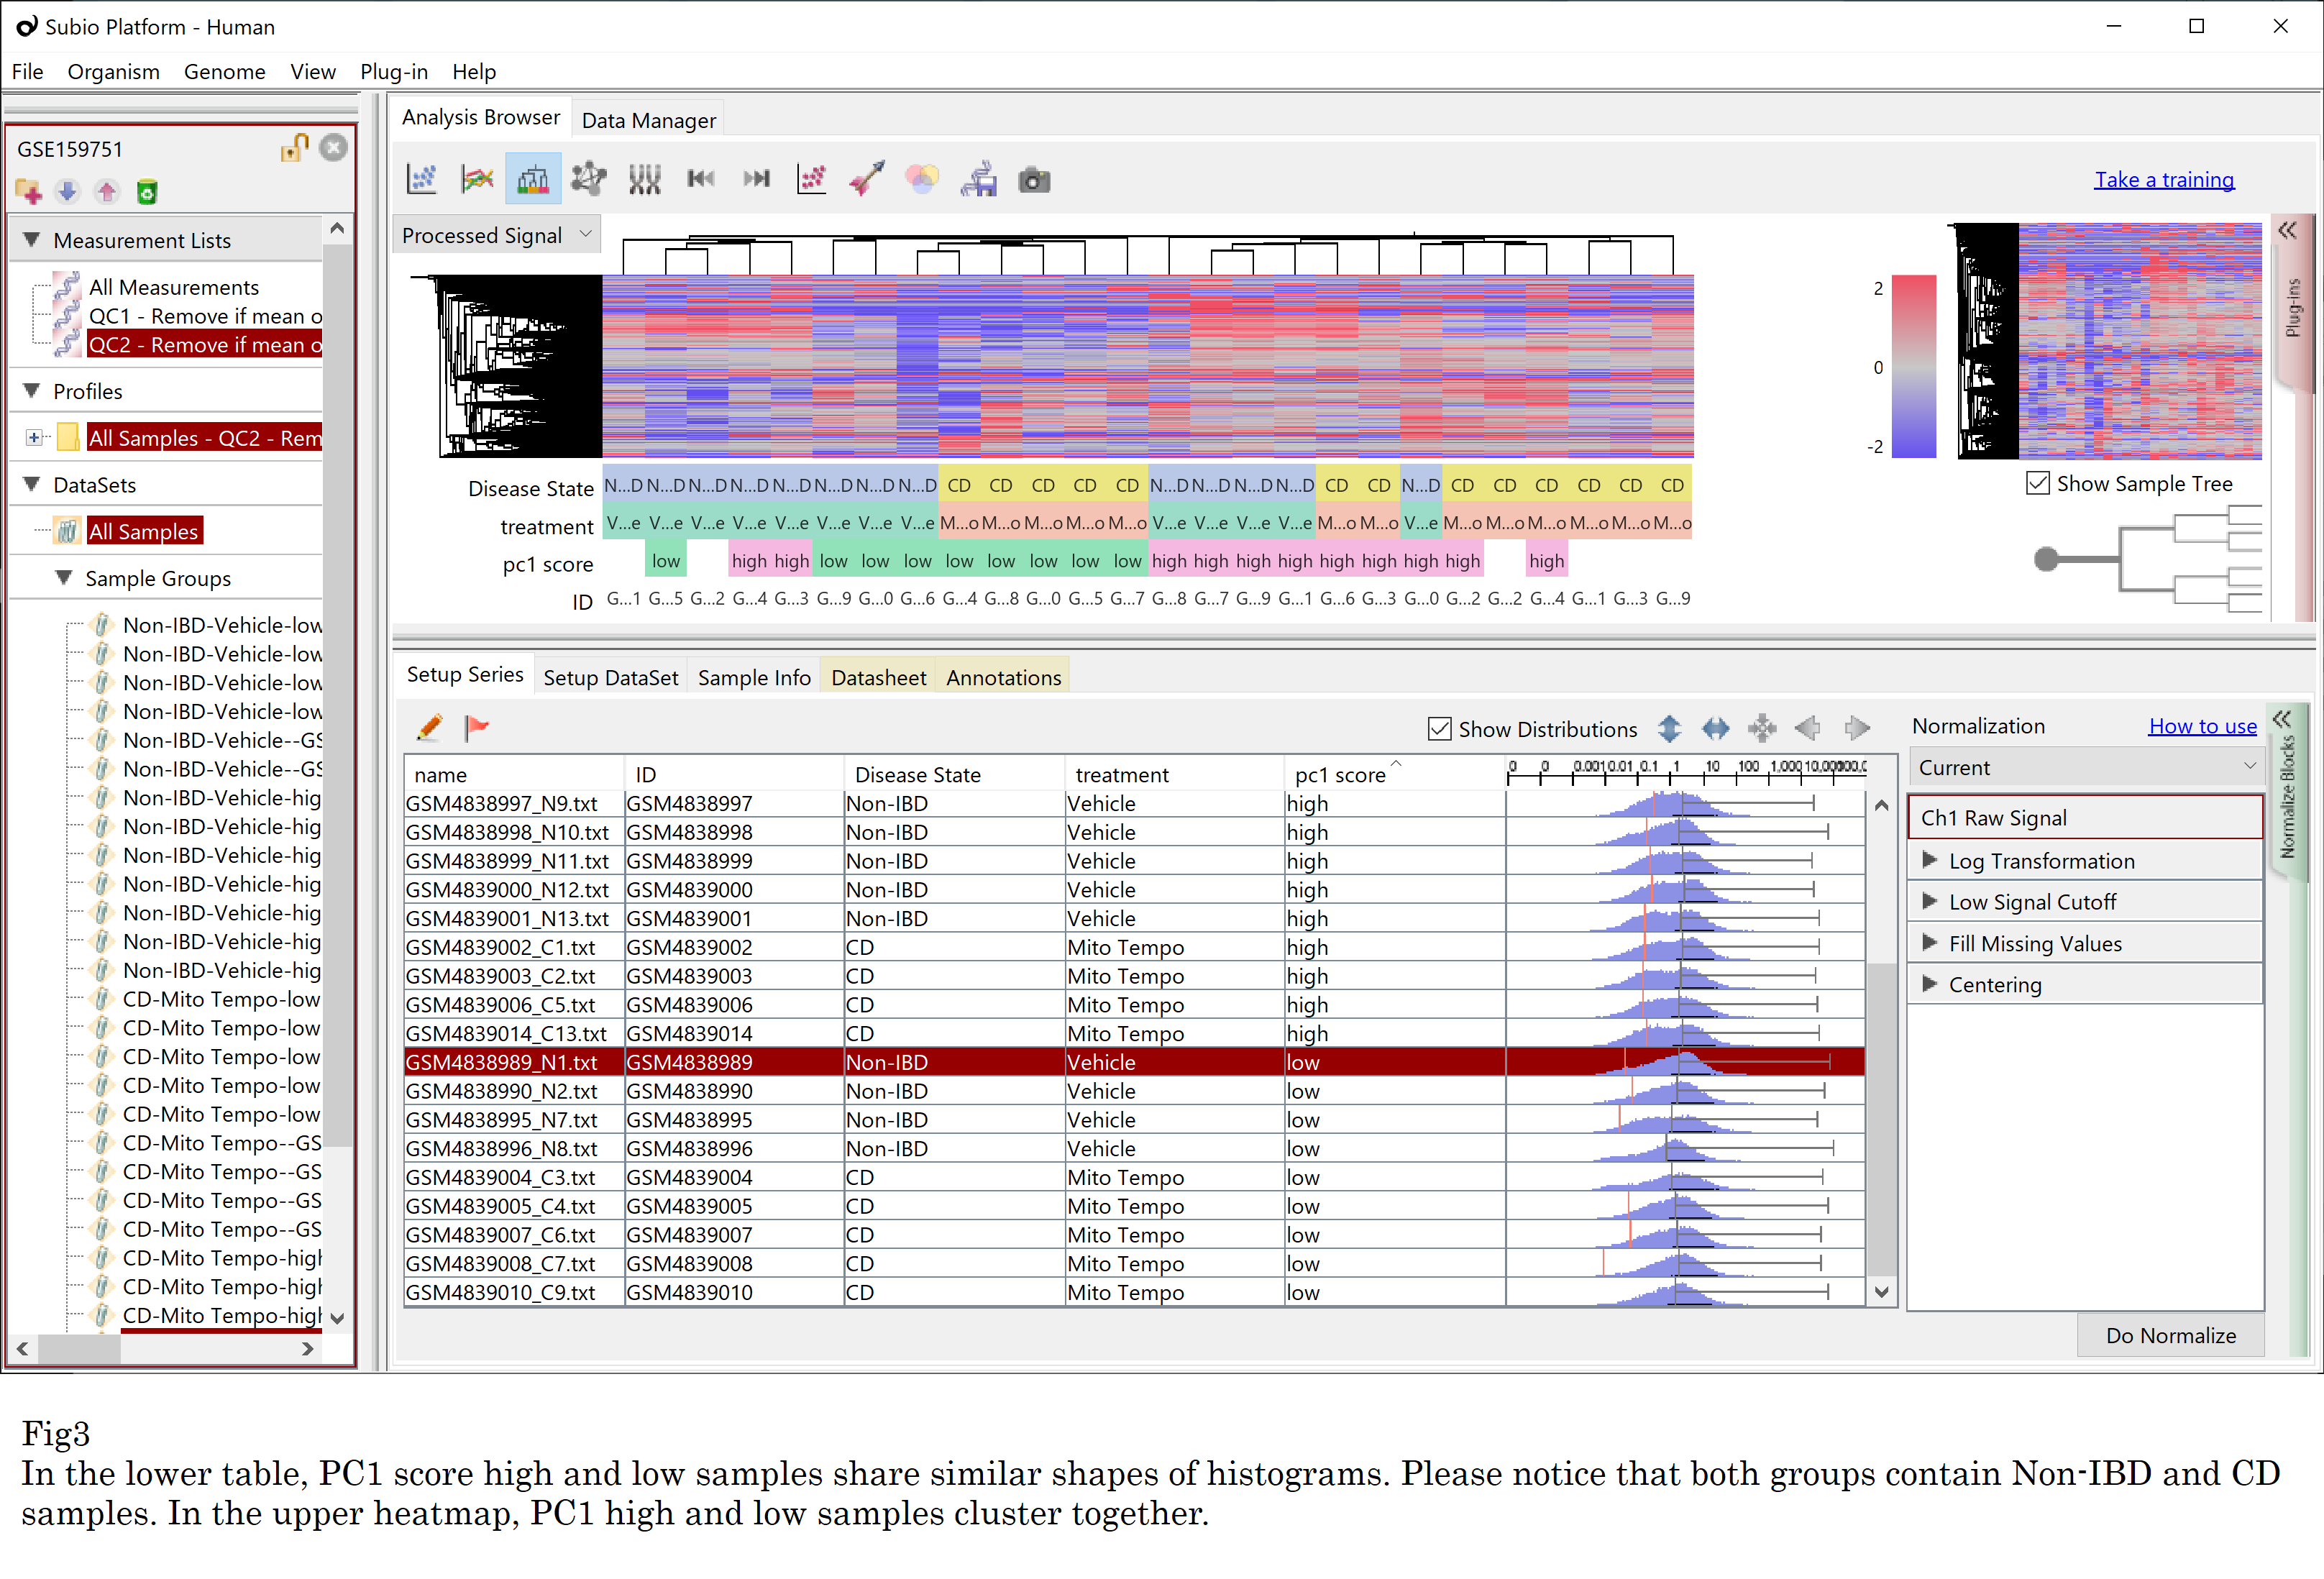
Then I executed hierarchical clustering on the data. Of course, samples are clustered not by the disease state but by the PC1 score classes as expected. More interestingly, the PC1 score classification relates to the shape of the histogram. (Fig3)
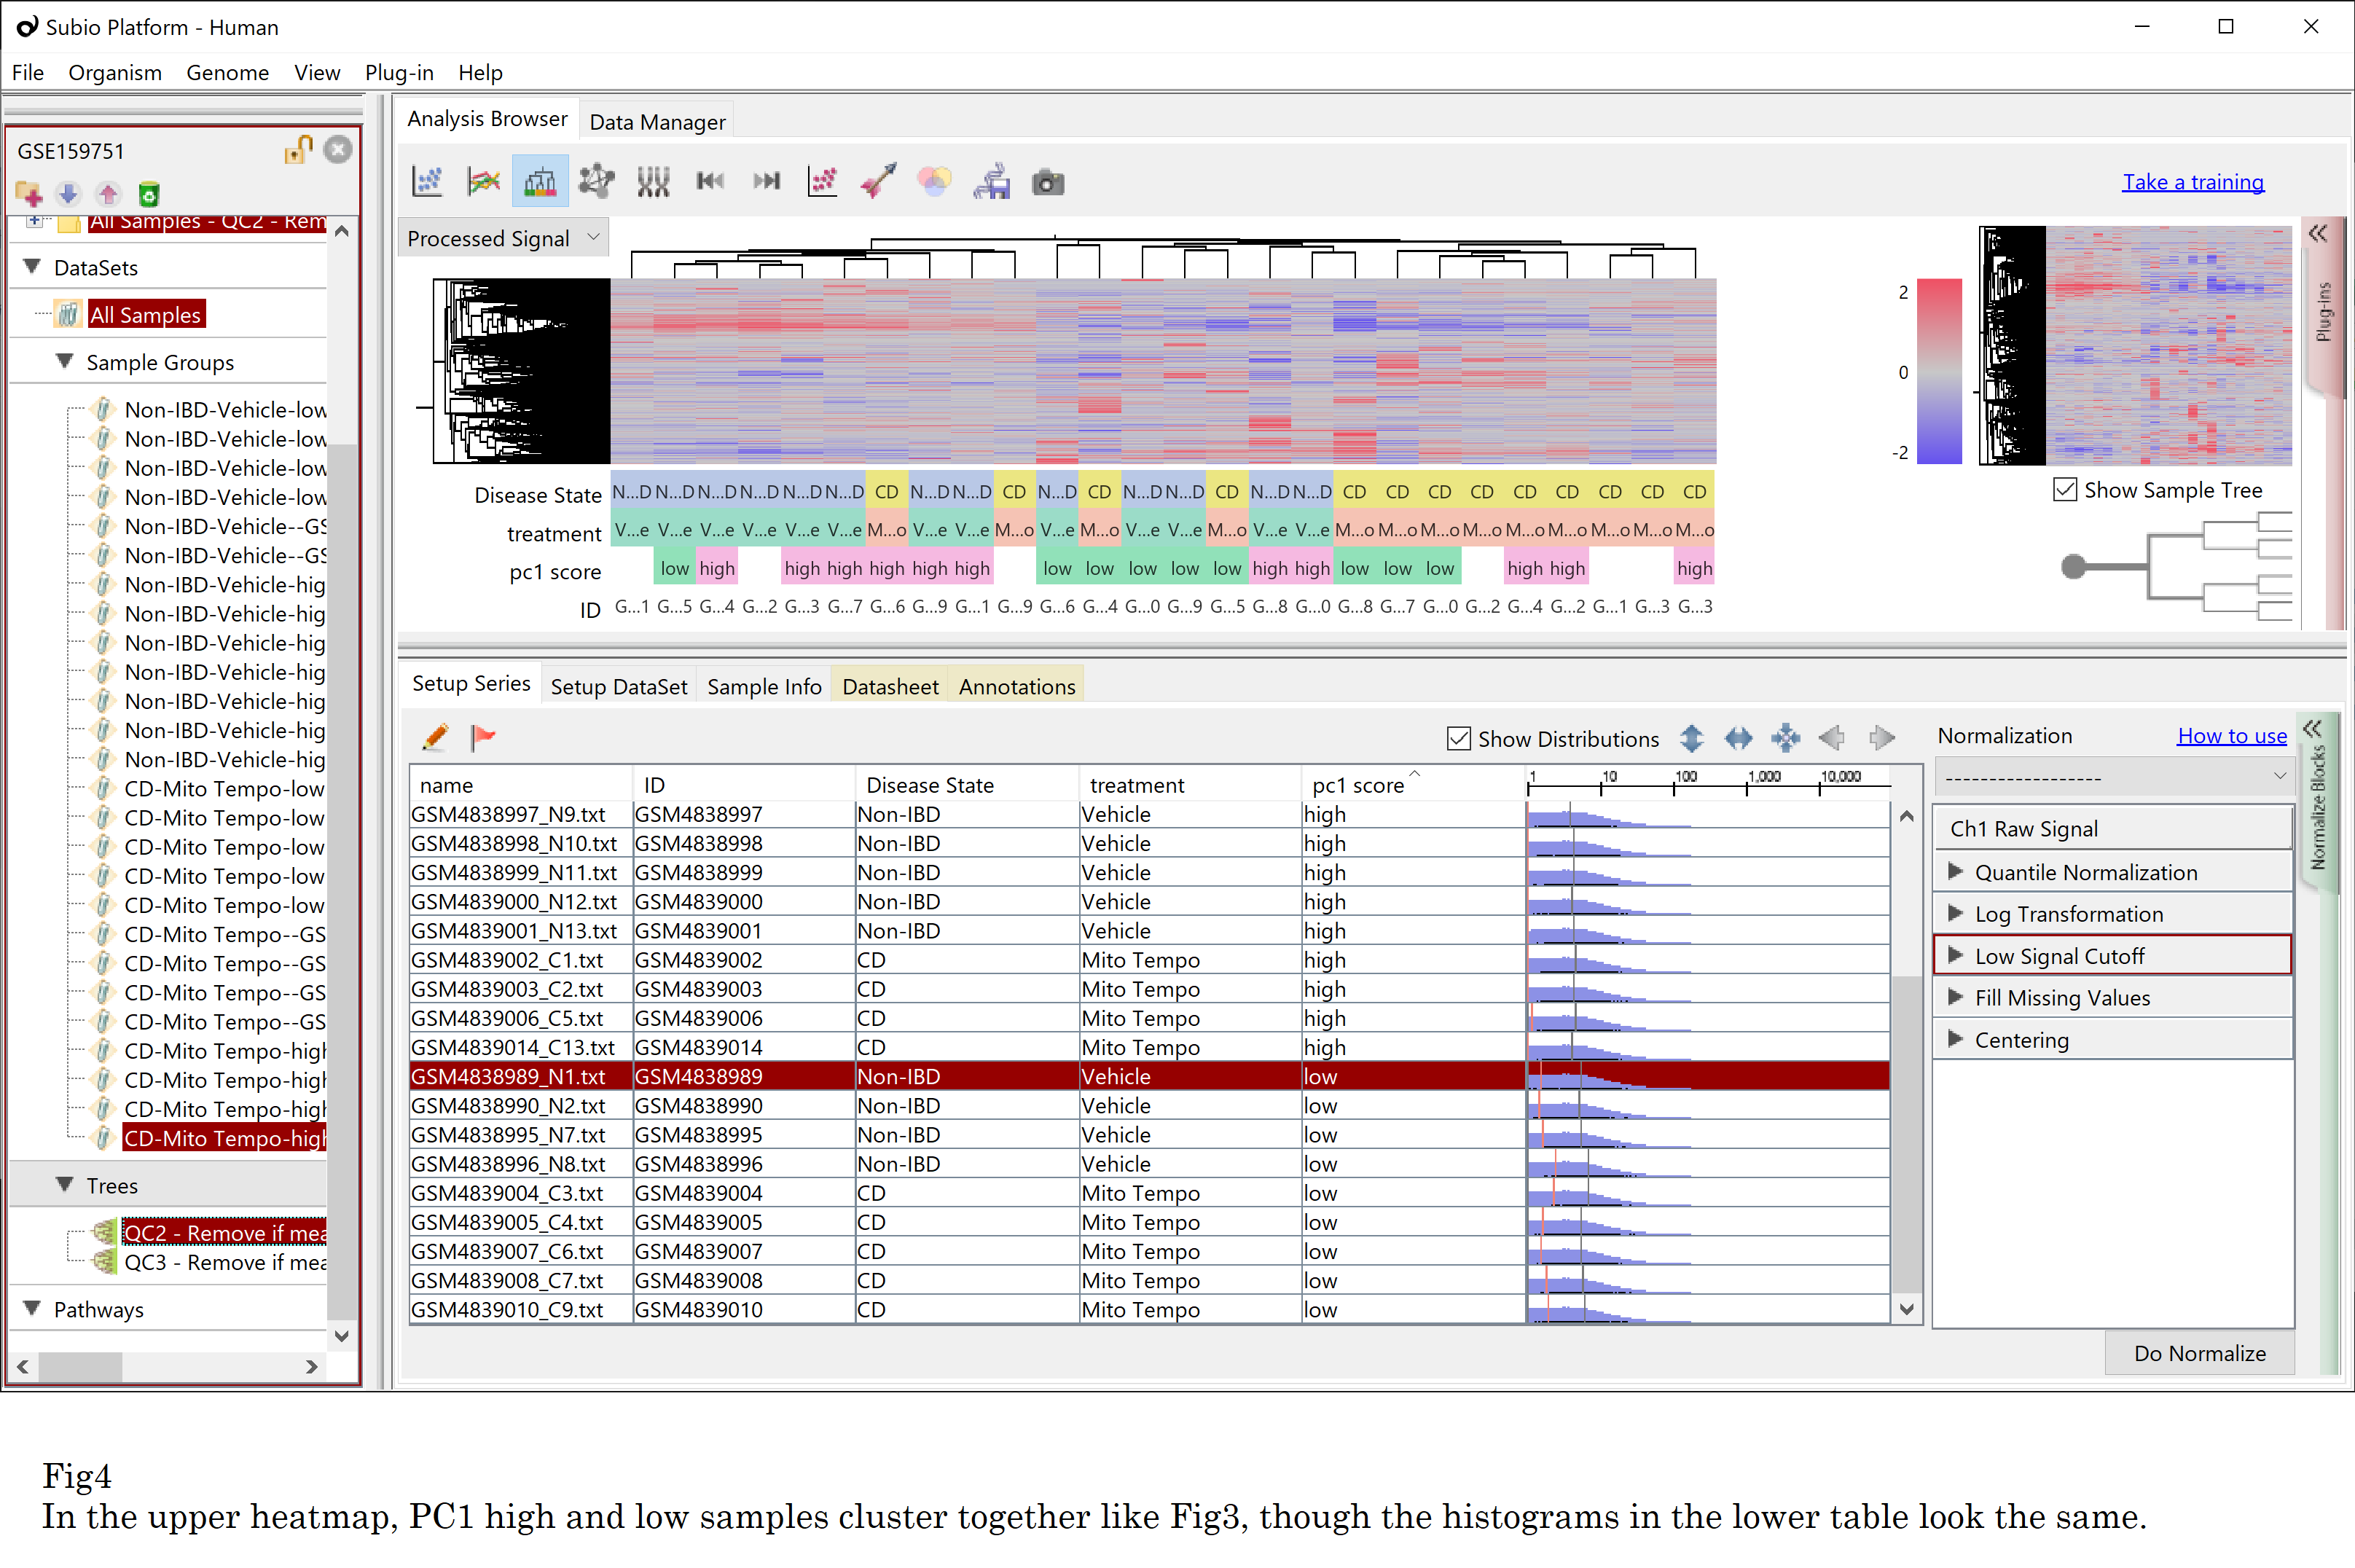
You might want to apply a more sophisticated normalization technique to force the shapes to resemble. So I used quantile normalization and reran clustering. However, the result is unchanged: the PC1 high and low samples clustered together again. (Fig4)
The fact that making the distribution shape resemble doesn’t correct the non-linear systematic error has already been known from the massive microarray data analysis, and it is valid for RNA-Seq, too. You must understand that there is no bioinformatic method to cancel the non-linear systematic error of omics data. Even worse, such sophisticated normalization techniques have hidden the problems in their data quality from researchers. (Please learn about cases of RMA or Z-score normalization.)
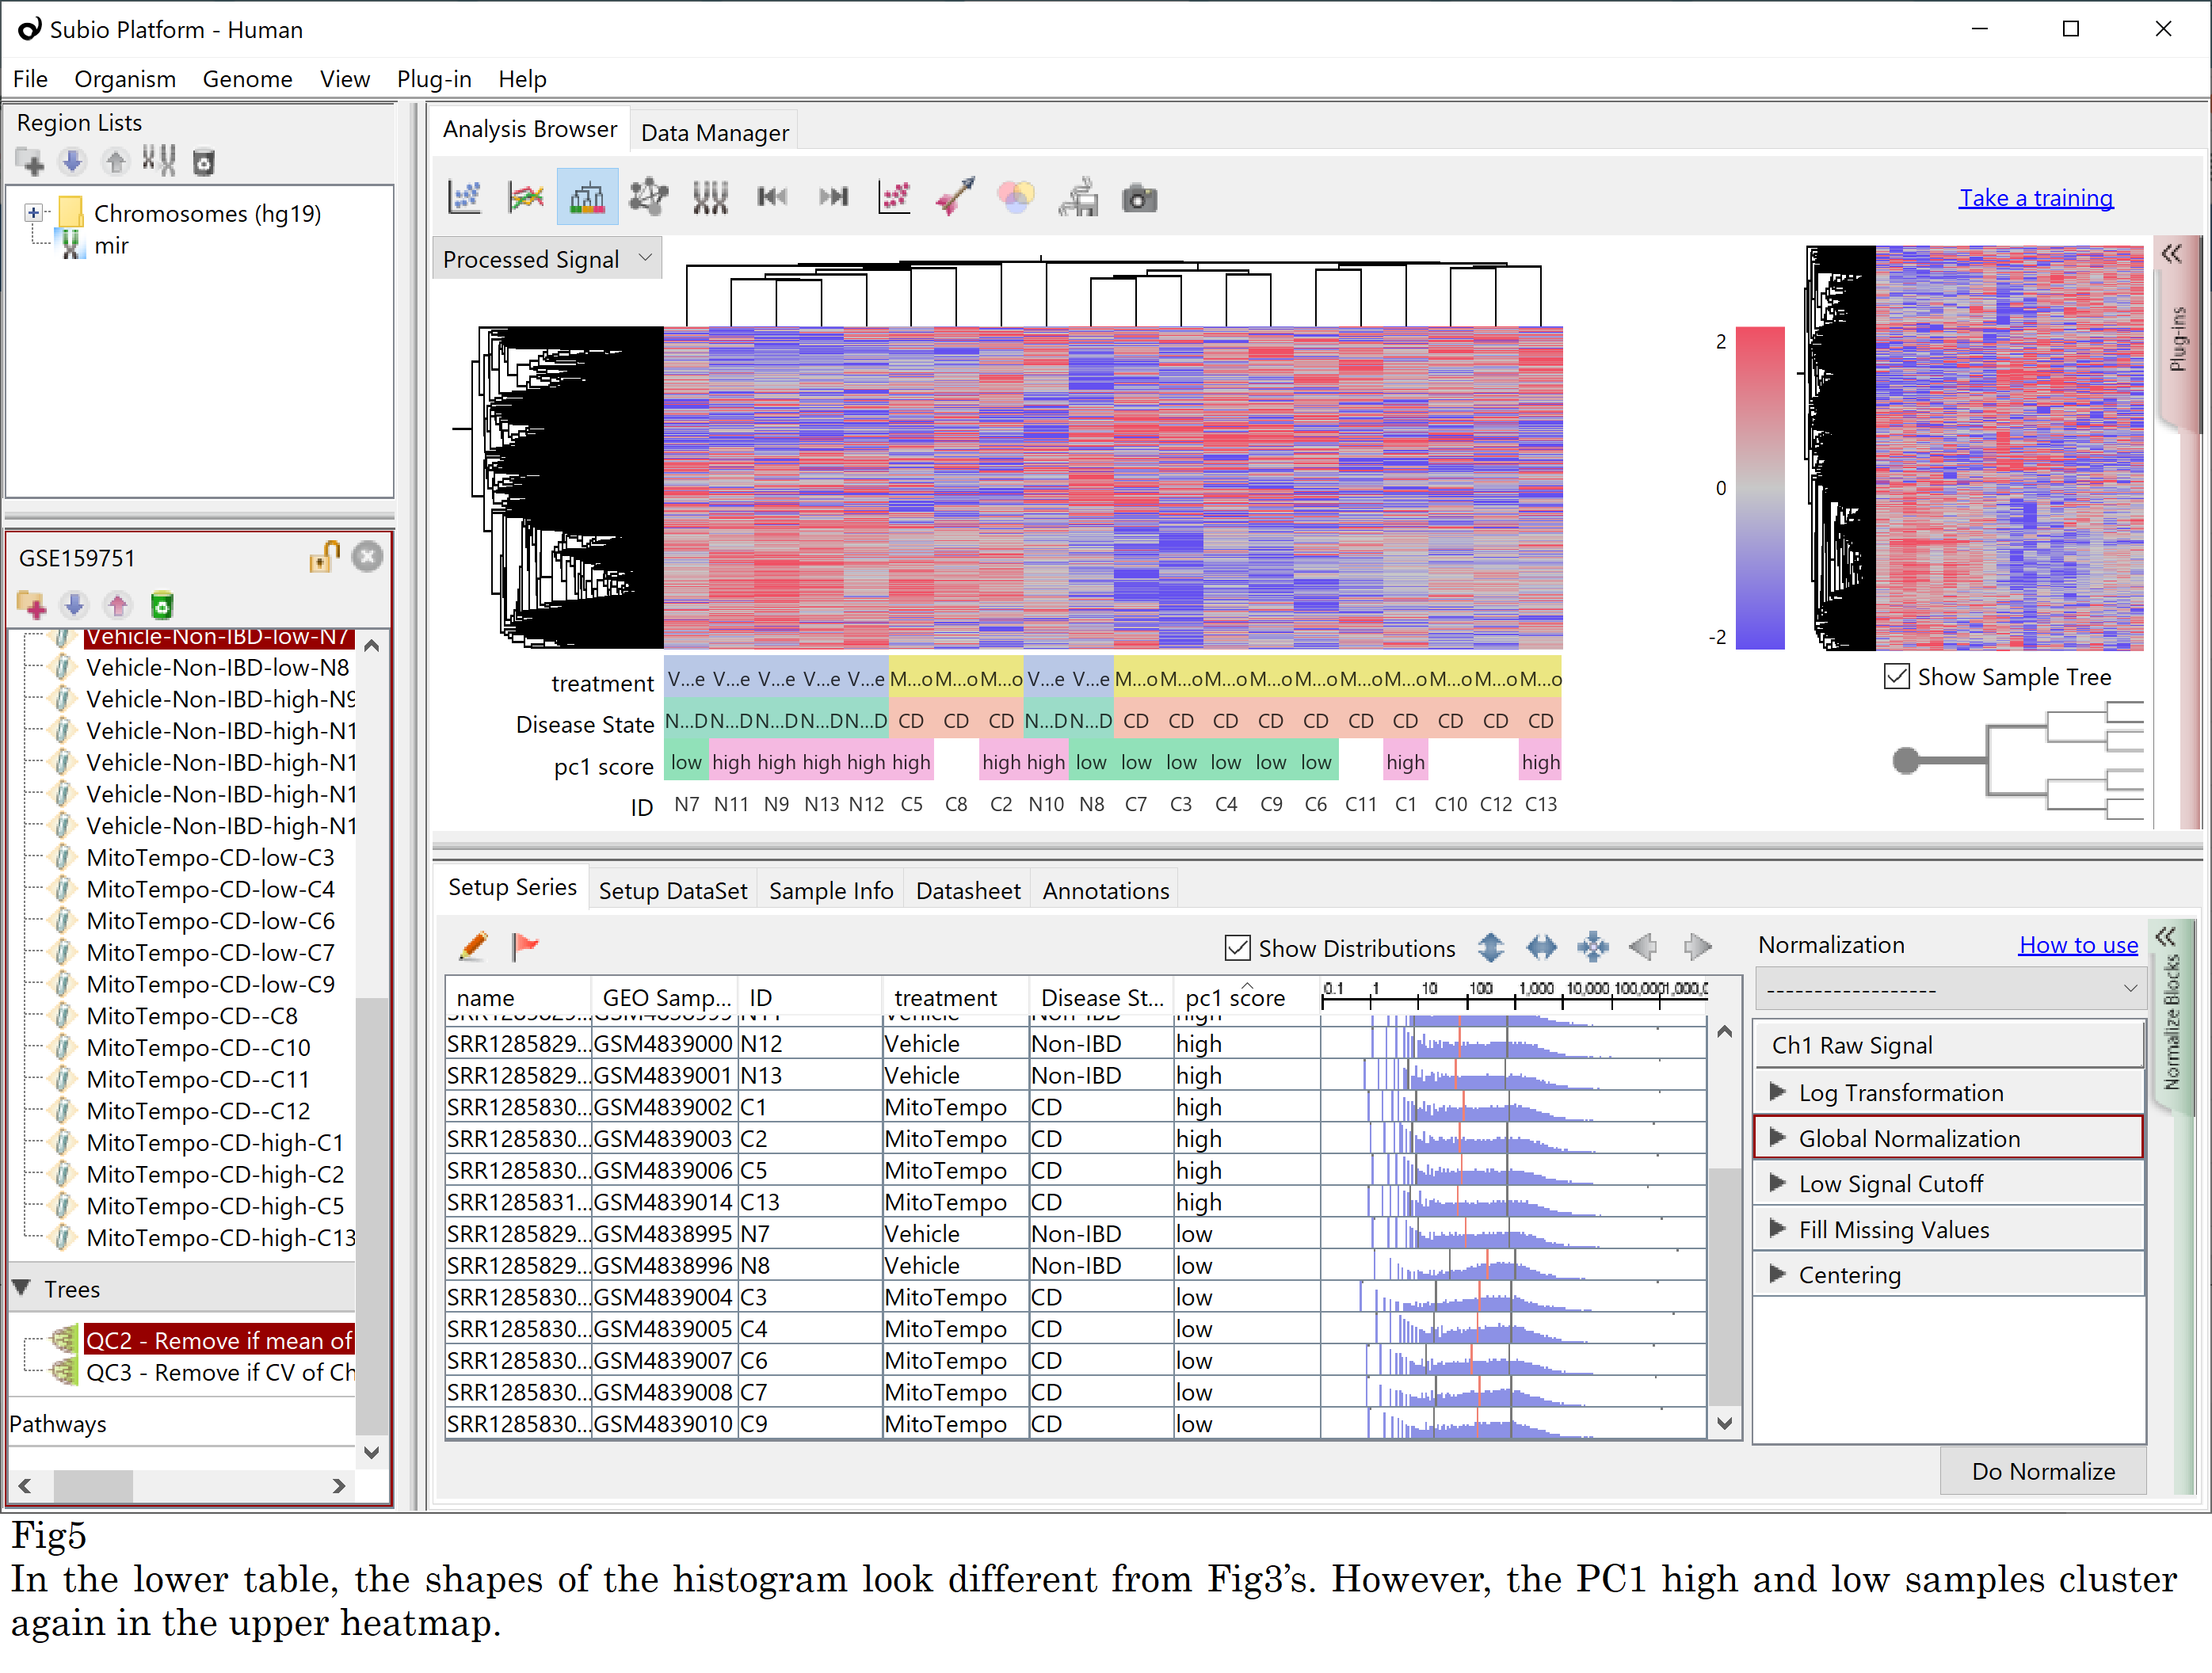
I’ll show you another experiment. I downloaded FASTQ files and re-quantified them with other algorithms; fastp, HISAT2, and StringTie. You can expect that different quantification generated different shaped histograms. But still, the PC1 score high and low samples are clustered again. (Fig5) So there must be intrinsic differences in the FASTQ files, and it dominates all subsequent analytical efforts.
Data analysis is not magic. It’s helpless in front of incomparable data sets. So the primary rule is to get samples of the same quality. But it is almost impossible, mainly when you collect a good number of samples or when you collect samples time by time. Therefore, we advise you of the second rule; to design the experiment to obtain a robust data set , assuming that the non-linear error inevitably happens.
For the same reason as above, merging data sets from different researchers is almost impossible except in exceptional cases. Would you please consult us for such merging cases?