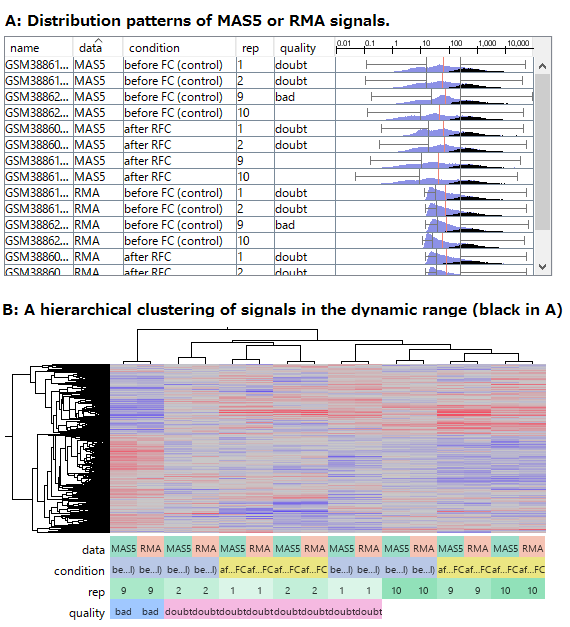
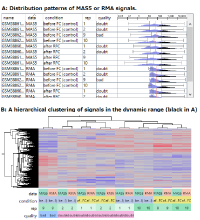
Fig3. Comparing RMA and MAS5 data of abundant genes.
- (A) The distribution patterns of RMA and MAS5 signals. Black indicates signals of abundant genes, which are reliably measured in the dynamic range.
- (B) The result of hierarchical clustering of the abundant genes (Black in A).
You can download the SSA file to import to your Subio Platform.
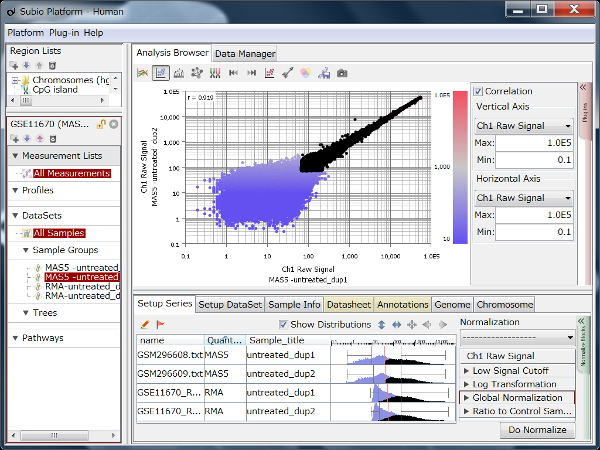
Fig4. MAS5 data of technical replicates on scatter plot and histogram.
GSE11670 is another example of HG-U133 Plus2.0 Array data with technical replicates of good quality. Dots widely scatter at lower left, indicating signals less than 100 are not reliable. Though the histograms of MAS5 look monomodal, but they're intrinsically bimodal. The peak is formed in between signals and noise, because the two components are close and gradual. Signals between 10 and 100 are less reliable, but not absolutely nonsense. You can download the SSA file to import to your Subio Platform.
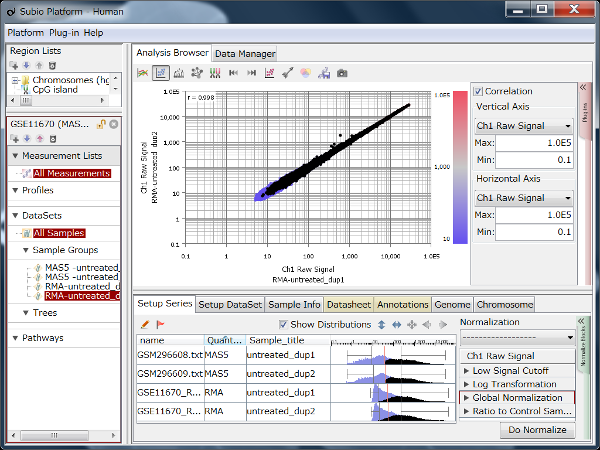
Fig5. RMA data of technical replicates on scatter plot and histogram.
GSE11670 data by RMA. There is no widely scattered area at left-bottom, but it doesn't mean there is no noise and all data are signals. Intrinsic noise must exist in a biological context. If you see histograms (row3 and 4), there are high peak at left side. It only converges low signals into small range. Signals between 10 and 100 are consequently much less reliable, comparing to MAS5 data.
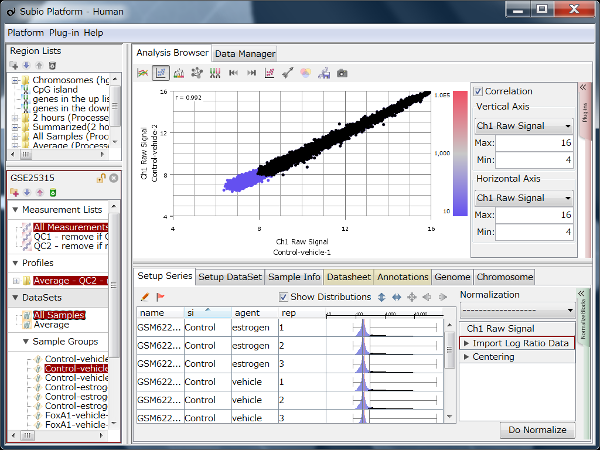
Fig6. Ilumina BeadChip data on scatter plot and histogram.
GSE25315 is obtained with Illumina BeadChip system. It apply RMA as quantification algorithm and that's why it looks highly reproducible on scatter plot. But if you see histogram at the same time, you immediately notice most of data are noise. It makes you realize how important to see histogram. You can download the SSA file to import to your Subio Platform.
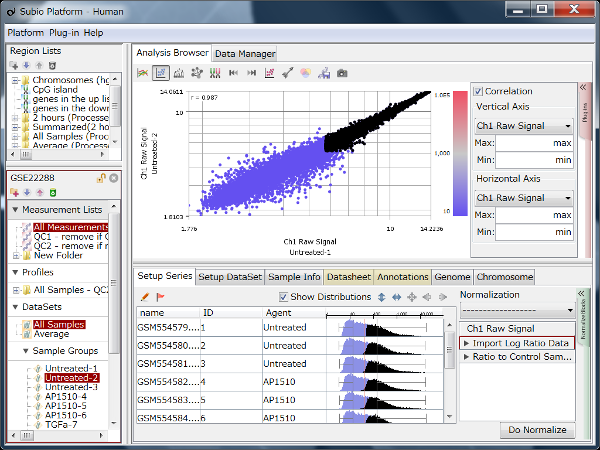
Fig7. Affymetrix Gene ST Array data on scatter plot and histogram.
GSE22288 is obtained with Gene ST Array, which came after 3' IVT Array (HG-U133 Plus 2.0). 3' IVT probes are designed in 3' UTRs because those sequences are more unique than exons. Gene ST probes are targeted exon. It seems the strategy makes data more ambiguous and less sensitive. New technology is not always better than old. It's not rare that matured technology is superior in history. There are tons of 3' IVT GeneChip data available on the web,sThis is another advantage you'd better to consider. You can download the SSA file to import to your Subio Platform.
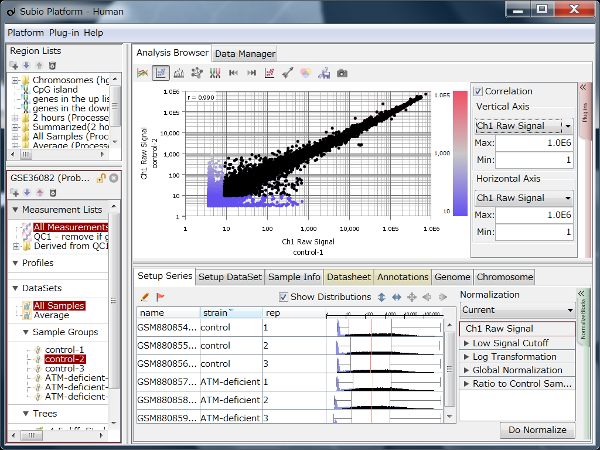
Fig8. Agilent Whole Genome 4x44k data on scatter plot and histogram.
GSE36082 is obtained with Agilent Whole Genome 4x44k microarray, which was a great achievement of microarray technology. And their SurePrint microarrays keep the paramount quality. There is a steep peak at the left end of histogram, which is formed by signals as low as negative control probes. What's good is the edge is brilliantly sharp. It seems you might have a chance to measure slightly expressing genes, or to distinguish not- and lowly-expressing genes. You can download the SSA file to import to your Subio Platform.
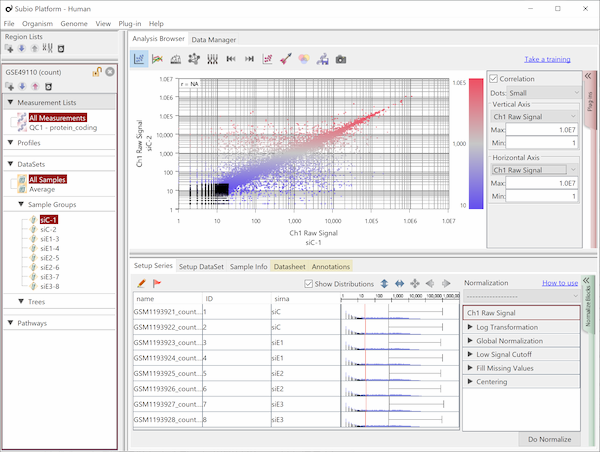
Fig9. Scatter plot of Count
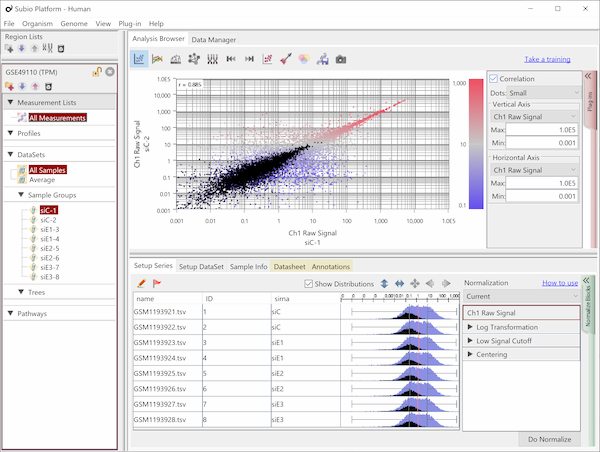
Fig10. Scatter plot of TPM
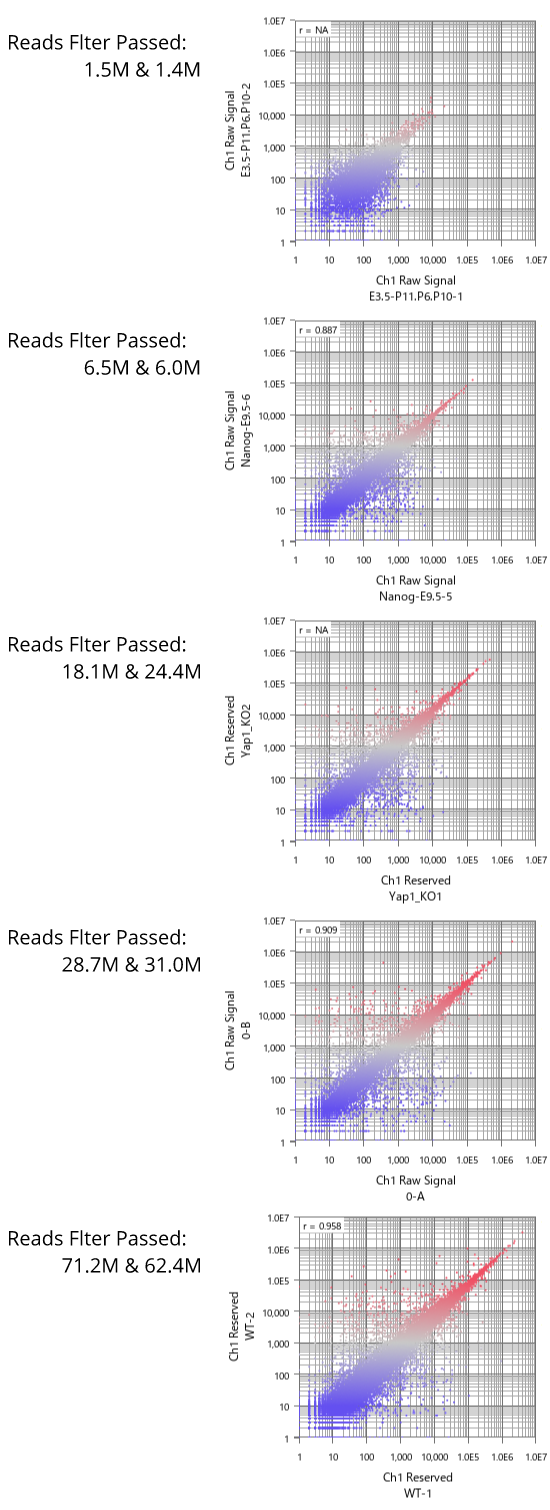
Fig11. The number of reads and the dynamic range of RNA-Seq
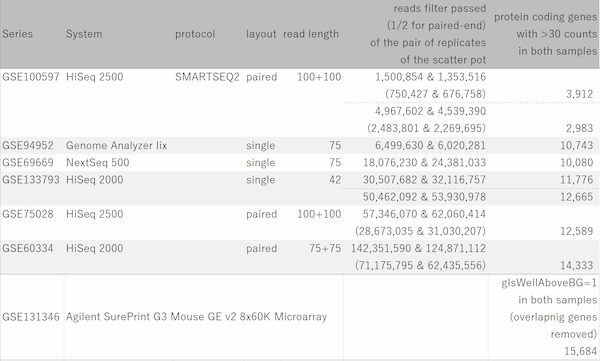
Fig12. The number of reads and the dynamic range of RNA-Seq
- Fig1.
- Fig2.
- Fig3.
- Fig4.
- Fig5.
- Fig6.
- Fig7.
- Fig8.
- Fig9.
- Fig10.
- Fig11.
- Fig12.
The Biases in Omics Data
Let's say there are 5 conditions you want to compare, and 10 replicates in each condition. So there are 50 samples in total.
| Number of Samles | |
|---|---|
| before_ R | 10 |
| after_ R | 10 |
| before_ FC | 10 |
| after_ FC | 10 |
| after_ RFC | 10 |
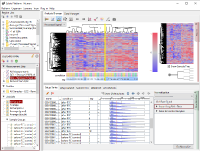
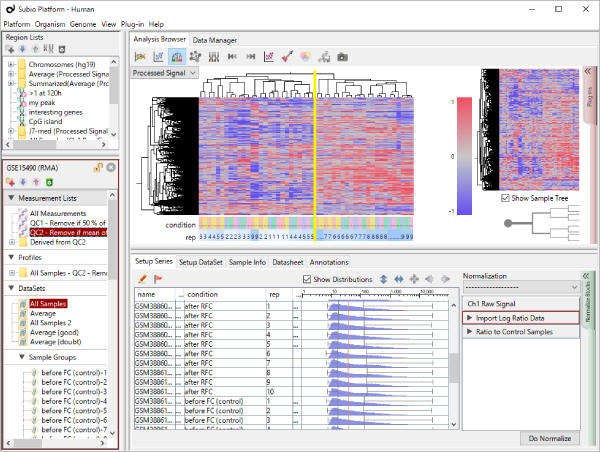
Fig1 shows the result of hierarchical clustering on the dataset. Samples are divided into 2 clusters which are of replicate 1 – 5 and 6 – 10, rather than the 5 conditions. (The yellow vertical line in Fig1.) Do you think there really are 2 types of expression profiles over the 5 conditions? From a view point of experimental biologist, you may instinctively sense there could have been experimental factors generating the bias.
If the instinct is right, non-linear bias is involved in the data. It is no appropriate you compare averages of the groups or apply ANOVA to detect differentially expressed genes. Maybe you divide into two datasets and analyze separately and then get a conclusion from the two results. Or maybe other idea is needed.
MAS5 and RMA
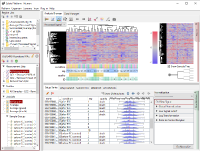
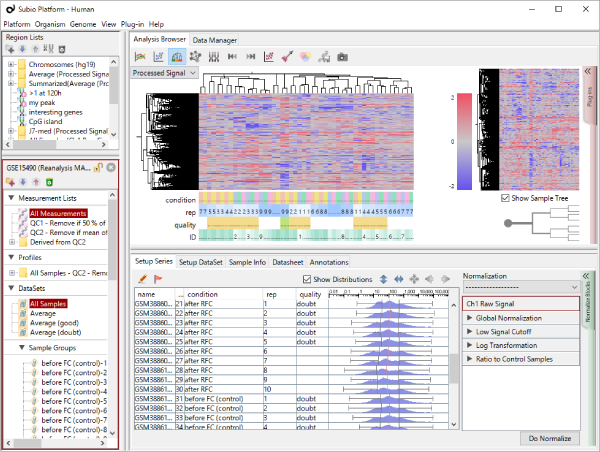
Though the histograms in Fig1 show signal distribution patterns, the signal is generated with RMA which is an algorithm of quantification of the raw data (CEL) files, and which includes a strong non-linear normalization method. So you can re-quantify the raw data files with MAS5 algorithm to see more directly. (Fig2)
Both data of Fig1 and Fig2 are generated from the same raw data files, the quantification algorithm has a significant effect on the result. If you look closely, you may notice that rep 1–5 and 6–10 have different distribution range of 25th and 75th percentile. MAS5 signals (Fig2), which reflect the raw data more directly, have wider dynamic ranges in rep 6–10 (>100), and narrower in rep 1–5 (>200). The dynamic range is not the range of all signals, but the range of trustfully measured signals. In other words, genes with signals at around 100 are reliably measured in rep 6–10, but not in rep 1–5. We do not know what brought such a difference between rep 1–5 and 6–10. Maybe it could come from dyeing or washing processes. Anyway, there are differences in dynamic ranges of signals, and it could result in the two non-sense clusters in Fig1.
RMA and other strong normalization algorithms had been invented to cancel non-linear biases like this case. Actually it looks successful if you look only in histograms or other charts visualizing signal distribution patterns. But it is very important to know that any normalization techniques never be able to cancel the bias really.
- (A) The distribution patterns of RMA and MAS5 signals. Black indicates signals of abundant genes, which are reliably measured in the dynamic range.
- (B) The result of hierarchical clustering of the abundant genes (Black in A).
You can download the SSA file to import to your Subio Platform.
By the way, although RMA (Fig1) and MAS5 (Fig2) signal distributions look very different, they look very similar if you only look at signals in the dynamic range. (Fig3 A, black) If you take only those data, the analysis results also look very similar. (Fig3 B) The difference of the two quantification algorithms treat differently only in noise range, or unreliable signals. (Fig3 A, blue)
You can download these SSA files from the links in Fig1 - 3 at the right to examine by yourself with Subio Platform.
Disadvantages of RMA
It is low-signal range where you see the large difference between MAS5 and RMA. We will not discuss which algorithm calculates better in the low range. But we cannot pretermit two disadvantages of RMA from the view point of interpreting results.
Firstly, signal distributions are uniformed by RMA and it hides the involved non-linear biases. It means you need more experience and carefulness, because only experienced analysts can sense the non-linear bias from the result of PCA or clustering, and would check experimenters, dates, places, or other experimental factors to bear out. But for most of analysts, hiding the bias easily misleads the conclusion.
Secondly, RMA makes it difficult to separate the signal and noise range. The microarray usually has probes for all transcripts. So there must be the noise range, because not all genes are expressing in one sample, and because every measurement system has lower limit on detection. RMA hides the noise, and it also misleads the conclusion for most of analysts. You can read more about the dynamic range of microarrays.
Moreover, RMA has two restrictions on the experimental design. You should not use RMA, if you cannot assume all samples have almost same expression profiles, or if you will continuously add samples in prospective studies. The former condition is very common in the biological study, like comparing different cell types, different compositions of cells types, different stages of the development or pathology, etc.
Consequently, MAS5 is superior to RMA from the view point of interpreting data or planning studies, MAS5 is no more available in new Affymetrix, which was taken over by Thermo Fisher Scientific, GeneChip systems. We think it is a stepping back of bioinformatics due to lack of biology.
Raw Data, Raw Data, Raw Data!
We do not intend to criticize a technology particularly, but would like to show an example of the current situation that unreasonable myths are making draw backs of the life science. "Sophisticated" normalization techniques can make data look good, but cannot remove the non-linear bias really. What is ultimately important is to brush up an experimental plan to get the high-quality raw data which do not need such cosmetic techniques. And we recommend you use a basic normalization technique to see the true characteristics of data.
The Solution We Offer, Subio Platform

Nobody knows how to handle omics data. Nobody knows how to extract meaning from omics data. We think it is not statisticians or bioinformaticians, but is an experimental biologist who will bring a critical idea someday. So it is essential to invite them to the table of discussion, at where everybody is equally amateur.
Please read why we create Subio Platform software, and what we offer to you who challenge the indeterminate problem.
Please read the following articles, too.