This case study uses GSE173789, an RNA-Seq dataset generated from CD19-positive B cells collected from healthy controls (HC) and patients with multiple sclerosis (MS). We examine differences in expression distributions and profiles across samples, and investigate how including or excluding groups of samples with particular characteristics changes the results of the comparison between HC and MS.
By moving between histograms, PCA, hierarchical clustering, and plots of individual gene expression patterns, we compared lists of differentially expressed genes (DEGs) and enrichment analysis results. Our focus is how strongly the results depend on the patterns of similarity and separation observed among samples.
“Why Do Samples Within the Same Group Differ More Than the Groups Themselves?”
One issue to consider in omics analysis is batch effects: systematic technical differences associated with factors such as experimental dates or library preparation batches. However, samples appearing separate from others does not, by itself, establish a batch effect. Using a real dataset, this article shows how to examine what is happening in the data through visualization before applying any correction.
Check the Distributions Before Taking Normalized Values at Face Value
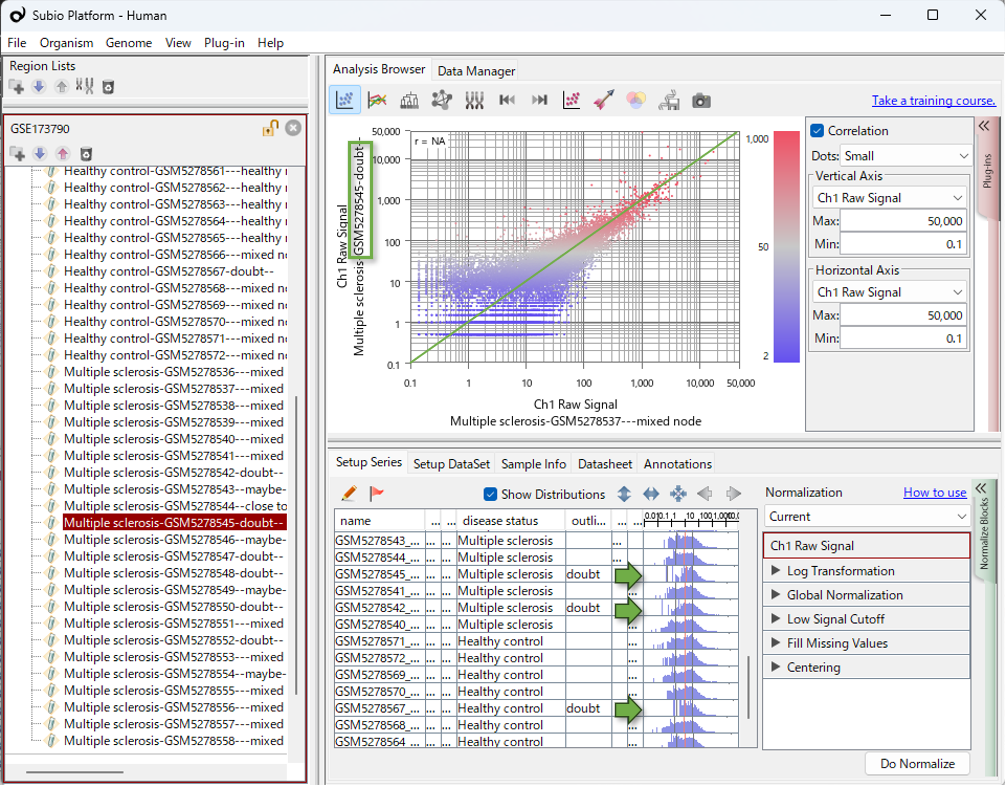
Subio Platform displays experimental parameters and histograms of expression values side by side in the same table, making it easier to identify possible relationships between them. Histograms show the distribution of gene expression values within each sample, while PCA, clustering, and line plots allow us to compare expression profiles across samples.
In the publicly available CPM data, some samples had few values at the low end of the distribution, giving their histograms a different shape from those of other samples. CPM (counts per million) expresses gene counts on a scale adjusted for library size. Many of the samples that appeared separate from the others in PCA were also those with relatively low read counts or small FASTQ files, according to the Sequence Read Archive (SRA). This correspondence was particularly clear for MS-13, MS-16 through MS-19, and HC-19.
We subsequently downloaded the FASTQ files again and generated new gene count matrices using Galaxy and RaNA-Seq. The QC reports also showed differences among samples in FASTQ file size, read counts, the number of reads assigned to genes, and other metrics. The QC reports and resulting gene counts are examined in more detail in the Galaxy case study and the article examining RaNA-Seq output.
When we examined the new gene count matrices in Subio Platform, the values in the corresponding samples were concentrated in the low-count range before normalization. Normalization scaled these values upward, shifting the distributions to the right and leaving few values at the low end of the normalized histograms. The distributional features observed in the public CPM data were also present in the data regenerated from FASTQ files.
In this article, we use “distributional distortion” to describe differences in distribution shape, such as a scarcity of low values in some samples compared with others. We do not determine what caused these differences or whether the affected samples should be classified as outliers.
Sample Separation Does Not Always End After One Round of Exclusions
As shown in the video, after excluding the samples with distributional distortions, six healthy control samples formed a cluster separate from the remaining HC and MS samples. Thus, excluding one group of samples does not necessarily eliminate the separation among expression profiles.
These six samples have consecutive IDs: GSM5278560 through GSM5278565. The combination of similar expression profiles and consecutive sample IDs gives us reason to consider a batch effect. Before reaching that conclusion, however, we need to examine at least two possibilities.
Possibility 1: The Pattern Reflects Biological Heterogeneity
Some healthy controls may have different biological backgrounds, and those differences may be reflected in their expression profiles. Age, sex, inflammatory status, medical history, or differences in cell subset proportions could contribute, for example. In this case, the separation among healthy controls may contain information that is important to the analysis. Such samples should therefore not be excluded without sufficient justification.
Possibility 2: The Pattern Reflects Experimental or Technical Differences
Alternatively, the separation among healthy controls may be related to library preparation, sequencing runs, sample processing dates, storage conditions, RNA quality, or other technical factors. In that case, the observed differences may reflect biases introduced during data acquisition or processing rather than biological differences associated with disease.
Analysis Algorithms Alone Cannot Resolve These Questions
In this situation, asking which statistical method will solve the problem is not enough. A different analytical method may change how the pattern appears, but that does not explain its cause. We also need information beyond the computational results. Clinical backgrounds, sample collection conditions, library preparation dates, sequencing runs, RNA quality, read counts, and laboratory records can help us assess whether the observed pattern reflects biological differences or technical biases.
Even with this information, some questions may remain unresolved. Analysts must then make their assumptions explicit and choose an approach consistent with the available evidence. The important point is to state the assumptions underlying the analysis. Whichever interpretation is adopted, those assumptions substantially affect what the results mean.
Omics analysis does not always lead to a conclusion through a purely mechanical sequence of steps. Analysts need to examine the data visually, investigate relevant background information, and make considered judgments. In principle, this kind of careful analysis is possible with any analysis tool. However, working through a commonly used pipeline shows that doing so in practice is not always straightforward .
Which Samples You Include Can Substantially Change DEG and Enrichment Results
In the video, we first identified seven samples positioned far from the others along PC1. We then identified six additional samples that clustered with them in the hierarchical clustering analysis, and repeated the comparison after excluding all 13. Among the remaining 24 samples, six healthy controls formed a cluster separate from the other HC and MS samples. We therefore performed a third comparison after excluding these six healthy controls as well.
We used the same DEG criteria and enrichment analysis settings for all three comparisons. The numbers of samples and genes identified as more highly expressed in MS are shown below.
How Sample Inclusion Affects the Number of Up-Regulated Genes
| Samples Included | HC Samples |
MS Samples |
Up-Regulated Genes |
|---|---|---|---|
| All samples | 14 | 23 | 586 |
| Excluding the 13 samples with distributional distortions | 12 | 12 | 1,297 |
| Excluding those 13 samples and the six-sample HC cluster | 6 | 12 | 336 |
Up-regulated genes: genes identified as more highly expressed in MS than in HC.
Only 54 genes were shared by all three up-regulated gene lists. The GO terms—categories describing gene functions and related attributes—identified by enrichment analysis also changed depending on which samples were included.
Excluding samples did not simply reduce the number of DEGs. These comparisons show that including or excluding particular groups of samples substantially changes both the number and identity of the genes detected, as well as the biological interpretations drawn from them.
Similar Issues Recur in Other Public Datasets
Figures 4A and 4B of the original paper show patterns of sample clustering and separation similar to those observed in our reanalysis. However, we found no description in the main text or supplementary materials of an analysis examining how including or excluding these groups of samples affects the DEG and enrichment results. In my experience analyzing public datasets, I have repeatedly encountered cases in which particular groups of samples strongly influence the comparison results, yet their impact is not examined in the corresponding papers. This led me to consider whether recurring features of the analytical process contribute to the problem, beyond how carefully any individual analyst works.
To investigate this possibility, we reanalyzed the same dataset from FASTQ files using Galaxy and RaNA-Seq. By working through each tool, we examined what QC information is presented at each stage and how easy it is to connect that information with expression profiles and comparison results. How might these patterns be overlooked in a standard analysis workflow? We explore this question in the Galaxy case study and the RaNA-Seq case study.
The Analyst’s Role
This article describes what I observed and how I reasoned through this dataset; it does not claim to offer the only correct interpretation. The aim is to show the importance of examining the data, considering multiple possibilities, and making clear where interpretations diverge. When the available evidence does not support a single explanation, analysts need to organize the results under different scenarios and present them for discussion with team leaders, experimental researchers, clinicians, pathologists, and others familiar with the background of the data.
Mastering advanced statistical methods is only one part of omics analysis. Visualizing the data, examining assumptions, and clearly explaining the data’s characteristics and the resulting findings are also essential responsibilities of an analyst.
What It Means to Learn Data Analysis
Learning data analysis means gaining experience with diverse datasets: visualizing them, developing hypotheses, checking those hypotheses, and making judgments. These skills take time and sustained practice to develop.
How Subio Supports Your Learning
Subio offers practical learning opportunities through online training, in which we work through your own data together. Although progress varies from person to person, approximately three to six one-on-one sessions over the course of a year can help you steadily develop your analytical reasoning and judgment.
If you need results sooner or would first like an expert assessment of your data, we recommend our data analysis service. The service goes beyond delivering a report. We help you understand the characteristics of your data and the steps involved in the analysis, then organize the evidence so that you can make informed judgments and draw your own conclusions.
Please contact us if you would like to learn more.
Learning commands and software operation is only the beginning.
What matters is learning how to analyze data.
Follow-up article:
We further examined the sample patterns observed in this case study using TMM, DESeq2 VST, quantile normalization, and ComBat.
Limitations of Batch-Effect Correction and Normalization in RNA-Seq
Related Topics
- RNA-Seq Data Analysis Tutorial: Exploring GEO Data and Interpreting Results
- What Is RNA-Seq DEG Analysis? Beyond P Values, edgeR, and DESeq2
- Omics Experiments Cannot Escape Nonlinear Bias
- RNA-Seq Gene Counts Are Not Directly Comparable Absolute Values: Integrating GEO Data and Addressing Batch Effects