When working with RNA-Seq data, you may wonder whether expression measures such as TPM, FPKM, or RPKM can be used directly for differential expression analysis.
Common questions include:
- Can TPM be used for differential expression analysis?
- Can a t-test be applied to FPKM or RPKM values?
- Can TPM or FPKM be used as input for DESeq2?
- How should we think about the differences among TPM, FPKM, RPKM, and Gene Counts?
- Can TPM or FPKM be used for visualization methods such as PCA or clustering?
In addition, many older RNA-Seq studies and public datasets report expression values as RPKM, FPKM, or TPM. Looking at these studies and datasets, it may therefore seem that using RPKM, FPKM, or TPM for differential expression analysis is a standard approach in RNA-Seq analysis.
However, the fact that these measures were widely used in the past does not mean that they are appropriate as input for differential expression analysis.
DESeq2 and edgeR, which are widely used for RNA-Seq differential expression analysis today, are designed to use Gene Counts rather than TPM, FPKM, or RPKM as input.
In other words, at least for current standard differential expression analysis using DESeq2 or edgeR, Gene Counts should be the starting point.
The main reason to use TPM or FPKM is when you want to compare relative expression levels among genes within the same sample. By contrast, when sample-to-sample comparisons, DEG analysis, and interpretation of the results are treated as a single, consistent analysis workflow, there is little reason to use TPM or FPKM.
Below, we explain why.
TPM, FPKM, and RPKM Are Expression Measures, Not Standard Inputs for Differential Expression Analysis
TPM, FPKM, and RPKM are all expression measures calculated from RNA-Seq read counts while accounting for factors such as gene length and library size.
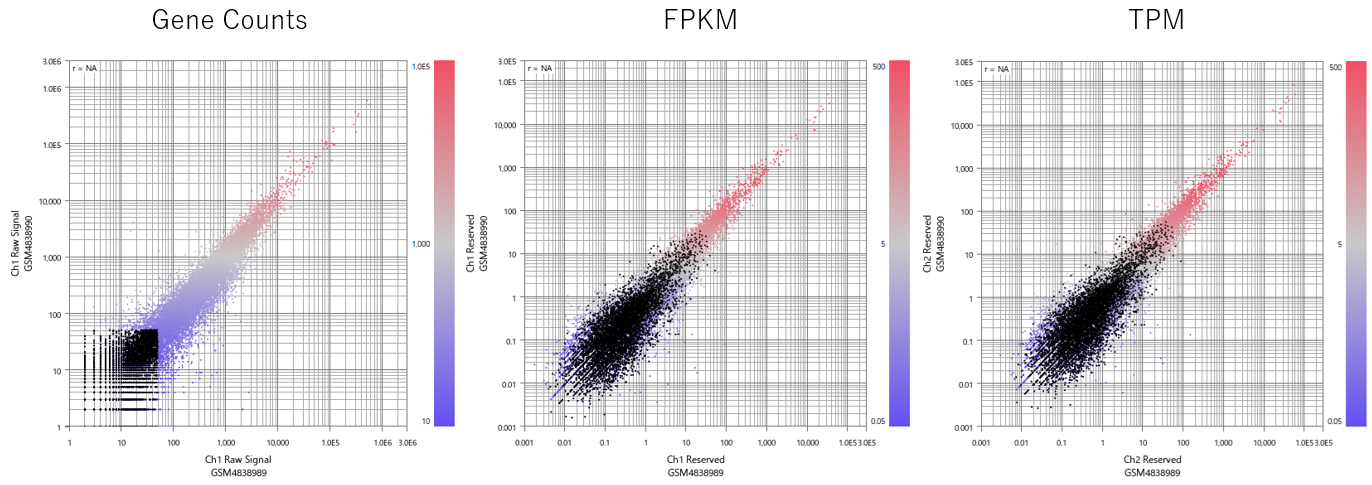
With raw Gene Counts, genes with low counts also have small numerical values, making it relatively easy to see that they are more strongly affected by measurement variability and sampling noise. (Left panel in the figure below.)
By contrast, TPM, FPKM, and RPKM include correction for gene length.
As a result, particularly for short genes, even a small original count can become a relatively large transformed value, whereas for long genes, even a moderately high count can become relatively small. Consequently, genes from the low-count region spread diagonally across the scatter plot, making values that may actually have low reliability appear similar to ordinary expression measurements. (Center and right panels in the figure below.)
You may have seen the explanation that FPKM or TPM should not be used with edgeR or DESeq2 because the “variance structure is disrupted.” In the figure below, Gene Counts show greater relative variability in the low-count region, making the relationship between expression level and variability comparatively clear. With FPKM or TPM, however, gene-length correction causes unstable values originating from low counts to spread upward, making this relationship less apparent. As a result, FPKM and TPM no longer retain the count-based mean–variance structure modeled by edgeR and DESeq2.
To understand this difference, it is also important not to simply treat variability in the low-count region as noise to be removed, but to consider which range can be treated as reliable signal. For a more fundamental discussion of noise, reproducibility, and dynamic range in gene expression data, see What Is Good Gene Expression Data? | Understanding Noise, Reproducibility, and Dynamic Range.

Can TPM Be Used for Differential Expression Analysis?
TPM is sometimes described as an expression measure that is easier to compare across samples than FPKM or RPKM. This may lead to the idea that TPM, unlike FPKM or RPKM, can be used for differential expression analysis.
However, TPM does not fundamentally solve this problem. TPM still involves correction for gene length, after which the values are scaled so that the total within each sample is constant. Therefore, the instability originating from low counts does not disappear.
TPM also has another important limitation. Because TPM values are scaled so that the total expression within each sample is constant, when the TPM of one gene increases, the TPM values of other genes may appear relatively lower.
In other words, TPM represents relative proportions within a sample and cannot be treated as though the expression level of each gene changes independently of all the others. This is commonly referred to as the compositional nature of the data.
The Main Reason to Use TPM, FPKM, or RPKM Is to Compare Genes within the Same Sample
So what are TPM, FPKM, and RPKM useful for?
The main reason to use these measures is when you want to compare relative expression levels among genes within the same sample. For example, if you want to examine whether gene A or gene B is expressed at a relatively higher level within a single sample, TPM or FPKM can be useful because they account for gene length and library size.
However, this does not mean that TPM, FPKM, or RPKM allow completely reliable comparisons of expression levels among genes. These values are still observed measurements affected by experimental conditions, mapping, annotation, gene-specific mappability, data processing, and other factors. Therefore, TPM or FPKM values should not be treated as absolute measurements that directly represent true expression levels.
TPM or FPKM Should Not Be Used as Input for DESeq2 or edgeR
DESeq2 and edgeR are widely used statistical methods for RNA-Seq differential expression analysis. They are designed around the statistical properties of RNA-Seq Gene Counts. Therefore, TPM or FPKM should not be used as input because these transformed values no longer have the count-data properties assumed by the models.
What about Using TPM or FPKM with a t-test?
TPM or FPKM values that retain instability originating from the low-count region are also not well suited to t-tests. With Gene Counts, the instability is concentrated mainly in the low-count region, so appropriate preprocessing, normalization, and filtering can be used to prepare the data for statistical testing.
With TPM or FPKM, however, instability originating from low counts becomes dispersed through gene-length correction, making it more difficult to handle through preprocessing and filtering. As a result, fluctuations near the detection limit or unstable differences originating from low counts may be identified as statistically meaningful differences.
Can TPM or FPKM Be Used for PCA or Clustering?
TPM or FPKM values are sometimes used to display expression levels or for visualization methods such as PCA and clustering. However, using Gene Counts for differential expression analysis while using TPM or FPKM for PCA and clustering is not always recommended.
As described above, if differential expression analysis is based on Gene Counts, it is more consistent to perform PCA and clustering for validation and interpretation using values derived from a processing workflow that also starts from Gene Counts. If differential expression analysis uses Gene Counts while PCA and clustering use TPM or FPKM, the analysis ends up comparing data that have undergone different transformations, making the results more difficult to integrate and interpret. In other words, it is important to maintain a consistent workflow from differential expression analysis through validation and interpretation, using Gene Counts as the starting point.
Start from Gene Counts and validate the results while looking at the data
With Subio Platform , you can import Gene Counts and carry out normalization, filtering, PCA, clustering, examination of expression patterns, differential expression analysis, and other steps in a consistent workflow while visualizing the data and analysis results.
What matters is not simply generating analysis results. By comparing DEG lists, PCA, clustering, and other results with the underlying expression data and expression patterns, you can better understand and validate the data structure from which those results arose.
A practical workflow using real GEO data is explained in the RNA-Seq Data Analysis Tutorial.
What If Gene Counts Are Not Available?
CPM adjusts for library size without applying gene-length correction or the compositional scaling specific to TPM. Therefore, although CPM does not fully preserve the statistical properties of raw Gene Counts, it retains characteristics that are closer to the original Gene Counts than TPM, FPKM, or RPKM.
CPM is not recommended as input for DESeq2 or edgeR. However, with appropriate normalization, preprocessing, and filtering, it can be useful for exploratory analyses such as t-tests, PCA, and clustering.
Therefore, if Gene Counts are unavailable, CPM is generally a more appropriate starting point than TPM, FPKM, or RPKM.
Summary
TPM, FPKM, and RPKM are expression measures that are frequently encountered when working with RNA-Seq data. However, they should not be used as standard inputs for differential expression analysis.
- TPM, FPKM, and RPKM are mainly useful for comparing relative expression levels among genes within the same sample.
- TPM does not fundamentally solve the instability or variance problems associated with low counts.
- Differential expression analysis should start from Gene Counts.
- For PCA and clustering, it is more consistent to use values that have been appropriately normalized or transformed starting from Gene Counts.
- If Gene Counts are unavailable, CPM is generally a more appropriate starting point than TPM, FPKM, or RPKM.
Related Topics
- RNA-Seq Data Analysis Tutorial | Learning the Analysis Workflow and How to Interpret Results Using GEO Data
- What Is RNA-Seq DEG Analysis? | Differential Expression Cannot Be Explained by P-values, edgeR, and DESeq2 Alone
- The Pitfall of “Well-Normalized” FPKM and TPM Data — Why Data Validation Matters in GSE159751