In RNA-Seq differential expression analysis, it is standard practice to consider not only p-values, but also adjusted p-values and FDR (False Discovery Rate).
Because thousands to tens of thousands of genes are tested at the same time, selecting candidate genes based only on p-values may include many genes that happen to show small p-values by chance. For this reason, multiple testing correction and consideration of FDR have clear importance. In this sense, it is entirely reasonable for bioinformaticians to recommend using FDR. It is also natural for reviewers to ask whether FDR correction was performed, or whether the results were evaluated using adjusted p-values.
However, should all RNA-Seq analysis results be judged mechanically only by whether they satisfy FDR < 0.05?
The reviewer’s concern about FDR is valid
As noted above, asking for FDR is not wrong in itself.
In RNA-Seq, p-values are calculated simultaneously for many genes. For example, if 20,000 genes that actually have no difference are tested at p < 0.05, about 1,000 genes are expected to show small p-values by chance. Therefore, if a gene list is created based only on p < 0.05, the list may contain many false positives. To avoid this problem, FDR correction is generally performed.
In particular, when an analysis pipeline automatically processes a large number of test results and outputs a differential gene list based on a fixed criterion, FDR serves as an important safety mechanism. If genes are selected based only on p-values without inspecting the data one by one, it is reasonable to use FDR to control false positives.
However, FDR < 0.05 is not an absolute rule
On the other hand, FDR < 0.05 is not an absolute rule that should be applied unconditionally.
There are several ways to estimate FDR, but in practice, correction by the Benjamini-Hochberg (BH) method is widely used. However, the BH method is not widely used because it is a statistically perfect method for RNA-Seq data. Methods such as Bonferroni correction are often too strict, leaving almost no candidates in exploratory analyses. For this reason, BH-based FDR correction is widely used as a practical method between uncorrected p-values and extremely strict correction methods.
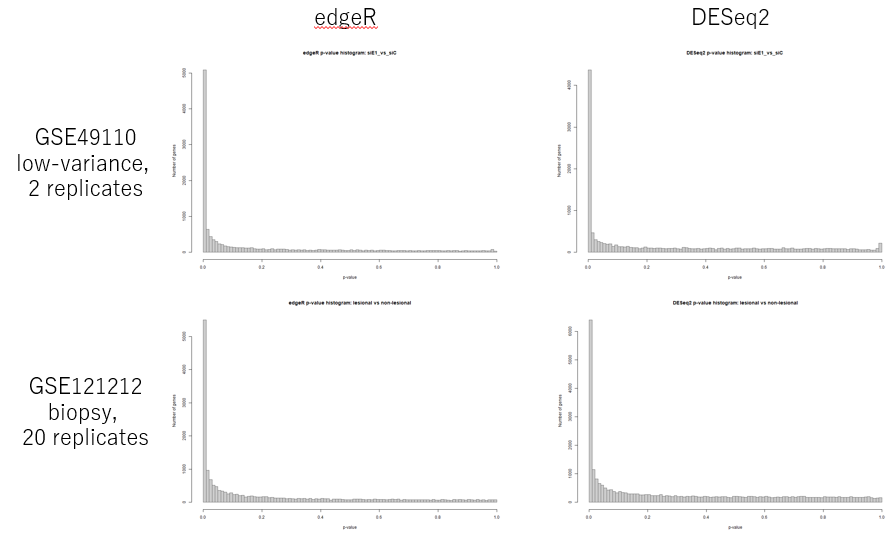
Fig. 1: Histograms of p-values calculated by edgeR and DESeq2. The p-value distribution obtained in actual RNA-Seq differential expression analysis does not simply spread uniformly from 0 to 1. As shown here, it often takes a strongly biased shape. This illustrates that, although BH-based FDR correction is useful, it is not an absolute decision rule that solves all the complexity of the data.
In other words, the BH method is not a method that “solves all statistical problems in RNA-Seq analysis.” It is recommended as a practical compromise for handling many tests: suppressing false positives to some extent while still leaving usable candidates for exploratory analysis.
Should the same FDR < 0.05 criterion be required for n=3, n=30, and n=300?
The criterion FDR < 0.05 is often used as if it were self-evident. However, it is not always reasonable to treat FDR < 0.05 as an absolute requirement in the same way when the sample size is 3, 30, or 300.
In analyses with small sample sizes, adjusted p-values tend to become strict because the degrees of freedom are low. As a result, even genes with large fold changes and biologically interesting changes often fail to satisfy FDR < 0.05. If only genes satisfying FDR < 0.05 are treated as “candidates worth looking at” in such data, the candidate set may become too narrow for exploratory analysis.
On the other hand, in analyses with very large sample sizes, even very small changes can produce extremely small p-values and easily satisfy FDR < 0.05. In such cases, satisfying FDR < 0.05 alone does not tell us whether the change should be emphasized.
In other words, even the same numerical criterion, FDR < 0.05, can have very different meanings depending on the sample size and the nature of the data. Fixing the FDR threshold does not fix the validity of the analytical judgment.
Is it always inappropriate to narrow down the genes to be tested?
When thinking about FDR, it is also important to consider which gene set is being tested.
Even in standard RNA-Seq differential expression analysis, not all genes are tested unconditionally. In many analyses, low-count genes are removed beforehand. For low-count genes, the relative variability of count data is large, and model-based estimation and testing tend to be unstable. Removing such genes before testing does not reduce statistical rigor; rather, it limits the test to genes for which testing is meaningful.
Then, if removing low-count genes is accepted, should removing genes that show no expression change from testing be rejected?
edgeR and DESeq2 estimate models using the dispersion structure of the entire count data. Therefore, in a standard workflow based on edgeR or DESeq2, it is necessary to remove low-count genes and then test the entire remaining gene set.
On the other hand, for t-tests or nonparametric tests that test each gene individually on normalized expression values, one can also consider excluding not only low-expression genes, but also genes that show almost no expression change in advance, and limiting the test to genes for which evaluating change is meaningful.
This is different from keeping only convenient genes after looking at the results. If the criteria for defining the testable gene set are set before testing, and if those criteria fit the purpose of the analysis, this is a reasonable approach. If FDR is to be used in the analysis, it is natural to think that appropriately narrowing the genes included in the test beforehand can help avoid unnecessarily losing candidates that should be examined.
Once p-values and fold change are combined, the analysis is no longer a simple hypothesis test
In actual RNA-Seq analysis, candidate genes are often not selected by p-values or FDR alone. Usually, fold change criteria are combined with p-values or adjusted p-values. At that point, the analysis is already no longer a pure hypothesis test.
Combining p-values and fold change is very natural in practice. The goal is not to obtain statistically significant genes, but to identify biologically meaningful changes.
If that is accepted, would it not be more useful to treat FDR flexibly according to the purpose of the analysis, rather than regarding it as an absolute rule?
The point is how p-values and FDR are used
How p-values and FDR should be handled depends on how the results will be used.
If a differential gene list is presented as a main conclusion of a paper, as a list of “statistically significant genes,” then it must be evaluated carefully based on FDR. However, in actual research, RNA-Seq results are more often used as an exploratory tool to find candidate genes or pathways for further investigation, rather than as final conclusions in themselves.
In that case, mechanically discarding genes that do not satisfy FDR < 0.05 can increase false negatives. If RNA-Seq analysis is used as exploration, p-values and FDR should be treated as one type of indicator for evaluating candidates.
The point is to clearly distinguish whether candidates obtained from RNA-Seq analysis
are being treated as final conclusions in themselves,
or as candidates to be followed up by qPCR, another dataset, functional experiments,
enrichment analysis, or other next steps.
See also: What Is RNA-Seq DEG Analysis? - Why P-values, edgeR, and DESeq2 Are Not Enough
What should be explained when FDR is not used as the only criterion?
If FDR < 0.05 is not used as the only criterion, then it is necessary to clearly explain what criteria were used to select candidates instead. Expression level, fold change, consistency across samples, expression patterns on heatmaps, consistency with related pathways, and the relationship to the next analytical or experimental step should be explained concretely enough for third parties to understand.
For example, in a paper or in a response to reviewers, this can be explained as follows.
In this analysis, p-values and FDR were treated as one set of indicators for evaluating candidate genes. However, candidate selection did not depend solely on the adjusted p-value threshold. We also considered expression level, fold change, consistency across samples, expression patterns on heatmaps, and consistency with related biological pathways.
This was because the RNA-Seq analysis was positioned as an exploratory analysis to obtain hypotheses for further validation, rather than as the final conclusion. Therefore, instead of mechanically selecting only genes satisfying FDR < 0.05, we broadly evaluated candidates that were worth advancing to experimental validation.
Explained in this way, the logic is not that “FDR was ignored,” but that “FDR was not used as the only automatic decision rule; multiple types of information were considered according to the research purpose.”
Reproducibility is not only about sharing raw data and code
In recent years, sharing raw data and analysis code has been strongly encouraged to improve research reproducibility. This is extremely important.
However, simply sharing raw data and source code does not fully ensure reproducibility of analysis.
This is because, in RNA-Seq analysis, decisions such as which genes are treated as candidates at which step, which thresholds are used, how low-expression genes are handled, and how FDR is used can strongly affect the reliability and interpretation of the results.
Therefore, what truly needs to be shared is not only the executed results. The analytical decision-making process itself should also be described: what steps were taken, and why particular methods and thresholds were chosen at each step.
Defaults are not absolute rules
It is understandable to use FDR < 0.05 as a default. In fact, when dealing with many test results in RNA-Seq analysis, it can be risky not to consider FDR.
However, a default is not an absolute rule. A default is a starting point when no further judgment is made. When actual data are inspected, the research purpose is considered, and analysis results are interpreted, it should be reconsidered as needed.
Many analysis software tools and R packages do not force FDR < 0.05 as the only fixed output. They allow users to examine p-values, adjusted p-values, fold change, expression level, filtering conditions, and other information, and to choose thresholds and evaluation criteria according to the purpose.
This shows that RNA-Seq analysis is not a simple automatic decision process, but a complex process that requires judgment while looking at the data.
Using FDR is not what makes an analysis honest. What makes an analysis honest is being able to explain for what purpose FDR was used, and in which situations the interpretation did not depend on FDR alone.
It is important for biologists to understand and discuss the analysis
To avoid treating FDR as an absolute criterion, one must be able to explain, based on the data, why a particular gene or pathway is being treated as a candidate.
For that, it is important for biologists themselves to understand the analysis results, and to discuss them in light of the research purpose while examining expression levels, fold changes, p-values, adjusted p-values, PCA, clustering, GO analysis, and pathway analysis results.
Bioinformaticians recommend FDR because they want to avoid the risk of mechanically handling a large number of test results using p-values alone. That concern is valid.
However, what is really needed is not a binary choice between using or not using FDR. It is the ability to present objective data from multiple perspectives and explain how the judgment was made.
Using Subio Platform to make judgments while looking at the data
Subio Platform is designed as an environment for this purpose.
RNA-Seq analysis results can be examined not simply as gene lists or p-value tables, but together with expression patterns, relationships among samples, clustering, PCA, GO analysis, and pathway analysis.
By thinking while looking at the analysis results, biologists can explain not only that “this candidate satisfied FDR < 0.05,” but also that “this candidate is worth validating next based on its expression pattern, effect size, and pathway-level consistency.”
This is not only for responding to reviewers. It is necessary for researchers themselves to decide what to read from RNA-Seq data and what should be validated next.
Summary: FDR is necessary, but do not outsource judgment to FDR
In analyses such as RNA-Seq, where many genes are examined at the same time, failing to consider FDR can lead to overvaluing genes that happen to show small p-values by chance. The concerns of bioinformaticians and reviewers who ask for FDR are valid. Especially when results are processed automatically without inspecting the data, FDR serves as an important safety mechanism.
However, FDR < 0.05 is not an absolute rule that must be followed in every situation.
What matters is not simply whether FDR was used, but whether the analyst can explain the reasons for the methods and thresholds chosen at each step of the analysis.
If FDR < 0.05 is used as a criterion, explain why.
If the analysis does not depend solely on FDR < 0.05,
explain what was considered instead.
With this explanation, FDR becomes not an “absolute rule to obey,”
but one piece of information to be used appropriately within the broader research process.