In RNA-Seq analysis, network analysis is sometimes added after differentially expressed genes have been identified. Multiple genes are connected by lines, and factors positioned at the center of the network or transcription factors predicted to act upstream are highlighted. Such diagrams can appear to explain the biological mechanisms underlying the phenomenon being studied more effectively than a simple list of genes. However, were the relationships shown by those lines actually confirmed in that study? If genes identified by RNA-Seq were merely connected using information from previous publications, the resulting network is not a new experimental finding. It is a hypothesis diagram constructed from existing knowledge.
In this article, we use GSE95304 and the corresponding paper, which include public RNA-Seq data, knockdown experiments, qRT-PCR, ChIP-Seq, and IPA network analysis, to examine what network diagrams show and what they do not show.
What Can RNA-Seq Tell Us? | Three Ways RNA-Seq Studies Proceed After Candidate Identification
RNA-Seq can identify genes whose expression differs between experimental conditions. However, RNA-Seq alone cannot determine whether a gene is related to the phenotype of interest, whether it regulates other genes, or whether its expression changed merely as a consequence of another biological change. Genes identified by RNA-Seq should therefore be treated as candidates for further validation. By knocking down or overexpressing a candidate gene and observing its effects on the phenotype and downstream genes, researchers can determine whether the gene is involved in the phenomenon under investigation.
RNA-Seq studies can be broadly organized into the following three approaches, depending on what is done after candidate genes are identified.
- Studies that report candidate genes identified by RNA-Seq
- Studies that experimentally validate the biological functions of candidates identified by RNA-Seq
- Studies that add a mechanistic explanation through knowledge-based network analysis instead of experimental functional validation
During the early period of omics research, studies were mainly either the first type, which reported candidate genes, or the second type, which experimentally validated some of those candidates. Today, however, knowledge-based analysis tools have become widely used, and simply listing differentially expressed genes is often considered insufficient as a biological explanation, depending on the purpose of the study. As a result, in addition to studies that experimentally validate the functions of candidate genes, many studies now interpret relationships among candidates through network analysis and add a mechanistic explanation.
However, these two approaches are not equivalent. In the second type of study, new evidence is added through experiments other than RNA-Seq. If the function of a candidate gene has been experimentally confirmed, the central results of the paper should be the process by which the candidate was identified and the functional validation of that candidate. By contrast, in the third type of study, genes identified by RNA-Seq are entered into a knowledge-based analysis tool and connected using relationships reported in previous publications. No new experimental evidence is added. Existing knowledge is simply rearranged.
Experimental functional validation and a network diagram generated from a knowledge base are fundamentally different types of evidence. A researcher who reads a paper carefully can distinguish between relationships confirmed experimentally and relationships inferred from previously published information. However, that distinction is not always preserved when the content of the paper is used in databases, knowledge graphs, network analysis software, literature-mining systems, AI-generated paper summaries, or automated knowledge extraction. If information about whether a relationship was experimentally confirmed or merely inferred from existing knowledge is lost when a mechanistic explanation based on a network diagram is reused, an unvalidated relationship may later be reused as established biological knowledge.
As a result, a network generated from previous publications may be presented as the mechanistic interpretation offered by a new paper, and that paper may then be incorporated back into a knowledge base and used as the basis for the next network analysis. Even when no new experimental evidence has been added, the same relationship may circulate between papers and knowledge bases, making it appear as though it has been repeatedly supported by multiple independent studies. This is, in effect, a self-reinforcing cycle created by knowledge-based network analysis.
Because knowledge-based network analysis represents relationships between genes using explicit lines and arrows, an unvalidated hypothesis can easily appear to be an actual regulatory mechanism. In this article, we use public data to examine the extent to which relationships inferred from a network diagram are supported by experimental results.
Experimentally Observed Relationships and an IPA-Generated Network | The GSE95304 Example
The paper corresponding to GSE95304 not only identified candidates using RNA-Seq, but also performed functional validation through gene knockdown. It can therefore be regarded as a study that combines the second and third approaches described above.
What Does the Network Diagram in Fig. 4C Mean?
In Fig. 4B, nine selected genes were individually knocked down, and the relative expression levels of the other genes were measured. Fig. 4C summarizes, using arrows, the cases in which the expression of another gene decreased following a particular knockdown. The arrows in this diagram converge on E2F1, EZH2, PAICS, and PTP4A1. However, no information has been added beyond what is already shown in the heatmap in Fig. 4B. Rather, because information about the magnitude of the expression changes and genes whose expression increased has been removed, Fig. 4C contains less information than the original heatmap. Nevertheless, because the relationships are represented as lines and arrows, the diagram gives the impression that more stable regulatory relationships have been demonstrated.
More importantly, it is not known whether these decreases in expression were caused by direct transcriptional regulation. They may instead have occurred indirectly through shared changes in cellular state, such as changes in cell proliferation, the cell cycle, or stress responses. The arrows in Fig. 4C therefore do not demonstrate direct regulatory relationships. They represent expression responses observed in specific knockdown experiments.
The quantitative RT-PCR results in Fig. 4B and the RNA-Seq results in Fig. 5H measure expression changes after some of the same gene knockdowns using different methods. However, the color schemes are reversed: decreased expression is represented by warm colors in one figure and cool colors in the other. The two figures must therefore be compared with careful attention to the direction of the color scale.
When the two figures are compared, the decreases in E2F1 and EZH2, on which many arrows converge in Fig. 4C, are not consistently reproduced in Fig. 5H. The quantitative RT-PCR and RNA-Seq experiments may differ not only in measurement method, but also in the shRNAs used, the time points, the experimental conditions, and the normalization procedures. This inconsistency alone therefore does not demonstrate that either measurement is incorrect.
However, relationships that are not sufficiently reproduced by another measurement cannot be generalized as a stable gene-expression regulatory network. When actual measurement values are shown, differences caused by experimental conditions or measurement methods can be examined. Once the results are reduced to a diagram containing only arrows, the original effect sizes and condition dependence are no longer visible, making it difficult to assess how reproducible the relationships actually are.
What Does the Network Diagram in Fig. 4D Mean?
In Fig. 4D, the nine genes and Fra-1 (FOSL1) were entered into IPA, and a broader network containing MYC, TP53, IL-6, VEGF, and other factors was constructed using relationships registered in the IPA knowledge base. Many of the relationships shown in this diagram were not measured in the LM2 cells used in this study. The network was created from existing knowledge, including relationships reported in different cells, tissues, diseases, stimuli, and measurement systems.
Therefore, Fig. 4D does not demonstrate that the network operates as drawn in the cells examined in this study. What can be said is more limited: the input genes can be connected in this way using relationships registered in the IPA knowledge base. Fig. 4D is not the result of discovering an actual network in this study. It is a hypothesis diagram that can be constructed from previously reported relationships.
Can ChIP-Seq Confirm a Gene-Regulatory Network?
ChIP-Seq data for Fra-1 (FOSL1), MYC, E2F1, and TP53 are also publicly available for this study. The paper uses these data to show that the four transcription factors bind to common genomic regions or near the promoters of the same genes. The authors interpret this shared peak pattern as coordinated binding. However, conventional ChIP-Seq shows only that, for each factor, DNA fragments derived from a particular genomic region were enriched by immunoprecipitation. It does not demonstrate that all four factors were simultaneously bound to the same DNA molecule in the same cell, or that they functioned as a single complex. Moreover, even when each factor has a peak within a broad promoter region of the same gene, the actual peak coordinates may not overlap.
Comparing Genes with ChIP-Seq Peaks and Their Expression After Knockdown
We therefore extracted genes with peaks near the transcription start site for each transcription factor from the public ChIP-Seq data and examined the expression patterns of those genes in the corresponding knockdown RNA-Seq data.
If a transcription factor positively regulates the expression of a particular gene, one would expect a peak near the promoter of that gene and a decrease in expression when the transcription factor is knocked down.
We therefore compared RNA-Seq expression changes after knockdown of the corresponding transcription factor for genes with ChIP-Seq peaks. The results are shown below.
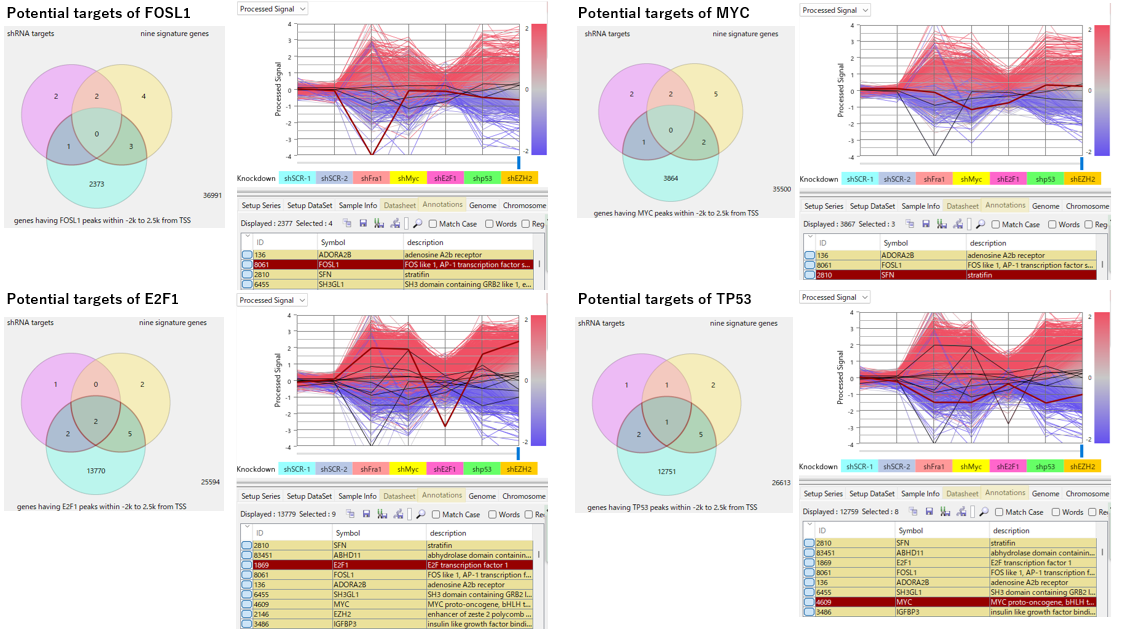
Using the same criteria as the original paper, genes with ChIP-Seq peaks for FOSL1, MYC, E2F1, or TP53 within the region from 2 kb upstream to 2.5 kb downstream of the transcription start site (TSS) were extracted as candidate targets of the corresponding transcription factor. The left side of each panel shows the overlap among genes with ChIP-Seq peaks, the nine genes selected in the paper, and genes whose expression decreased after shRNA treatment. The right side shows RNA-Seq expression changes after each shRNA treatment for genes with ChIP-Seq peaks.
Upper left: Candidate FOSL1 targets. FOSL1 itself has a FOSL1 ChIP-Seq peak near its TSS. FOSL1 expression decreases after shFra-1 treatment, confirming that the knockdown was effective. However, the other genes with FOSL1 ChIP-Seq peaks do not show an overall decrease in expression after shFra-1 treatment.
Upper right: Candidate MYC targets. This panel shows genes with MYC ChIP-Seq peaks near their TSS. SFN expression decreases after shMYC treatment, but the candidate target genes as a group do not show a consistent decrease in expression after shMYC treatment.
Lower left: Candidate E2F1 targets. E2F1 itself is included among the candidate target genes, and its expression decreases after shE2F1 treatment, confirming that the knockdown was effective. However, compared with the other shRNA treatments, the candidate target genes show the smallest expression changes after shE2F1 treatment, and genes with E2F1 ChIP-Seq peaks do not show an overall decreasing trend. The shE2F1 group also shows greater variation between replicate samples than the other shRNA groups. The relatively small expression changes observed in the group-average profile are therefore likely to reflect, at least in part, this greater variability.
Lower right: Candidate TP53 targets. Among genes with TP53 ChIP-Seq peaks near their TSS, MYC and FOSL1 show decreased expression after shTP53 treatment. However, MYC expression also decreases after four of the five shRNA treatments other than shE2F1. The decrease therefore cannot be regarded as a response specific to shTP53.
These results show that the presence of a ChIP-Seq peak near the TSS does not necessarily mean that the gene will decrease in expression when the corresponding transcription factor is knocked down. A ChIP-Seq peak suggests that the transcription factor binds to the surrounding genomic region, but whether that binding promotes expression, represses expression, or has no effect on expression must be examined together with expression data such as RNA-Seq.
In this comparison, genes with ChIP-Seq peaks near the TSS did not show a consistent decrease in expression after knockdown of the corresponding transcription factor. Therefore, the factor-specific and consistent gene-regulatory network suggested by Fig. 4 and Fig. 5 could not be confirmed from the correspondence between these ChIP-Seq and RNA-Seq data.
A Large Number of Shared Targets Does Not Mean That the Four Factors Act as Equal Partners
The public ChIP-Seq reanalysis did confirm that multiple factors have peaks near the TSS of the same genes. However, a closer examination of the set structure showed that E2F1 and TP53 had peaks near a very large number of genes, and that most of their candidate targets overlapped. By contrast, the overlap between the candidate targets of FOSL1 and MYC was not particularly large. The large number of candidate targets shared by all four factors therefore appears to result not from all four factors acting as equal partners and selectively converging on a limited set of common targets, but from the partial overlap of the FOSL1 and MYC target candidates with the very large E2F1-TP53 shared set.
Identifying shared candidate targets by ChIP-Seq is not the same as demonstrating that the four factors coordinately regulate the expression of those genes. What could be confirmed here was the overlap among genes with peaks. We could not confirm that this overlap was reflected in coordinated gene-expression regulation in the RNA-Seq data.
Even a Network Based on Experimental Data Is Difficult to Validate
Fig. 4B is based on actual gene knockdown and expression measurements. Fig. 4C is a relationship diagram that summarizes the observed decreases in expression using arrows. Even so, the features that appear to represent stable regulatory relationships in Fig. 4C were not sufficiently reproduced in the RNA-Seq results shown in Fig. 5H. Furthermore, comparison of the public ChIP-Seq and RNA-Seq data did not reveal a consistent relationship supporting either the factor-specific regulatory relationships suggested by Fig. 4C or the IPA network in Fig. 4D.
In other words, even a relationship diagram based on experimental data obtained within the same study is not easy to validate as a stable gene-regulatory network. It should therefore be considered even more difficult to interpret a network created by connecting previously reported relationships obtained under different experimental conditions as an actual biological mechanism operating in the system being studied.
IPA Is Useful for Hypothesis Generation
This does not mean that tools such as IPA are useless. They can be useful for deciding which factor to knock down next, which pathway to investigate further, or which combinations to test using ChIP, reporter assays, inhibitor experiments, or other methods. In other words, an IPA network should primarily be used as an internal research aid for generating hypotheses to be tested next.
However, presenting such a network in a paper as a mechanistic conclusion of the study is problematic. If it is presented in that way, the major relationships shown in the diagram must be validated. Knocking down a small number of nodes and observing expression changes in a few genes does not validate the entire network or its individual edges. If a network diagram is included in a paper, at least the major arrows that contribute to the conclusions of the study should be experimentally tested for directionality, reproducibility, condition dependence, and, where possible, directness.
When a network is used for hypothesis generation, it should be treated as an unvalidated working hypothesis and used as an internal resource. When it is presented as a research result, the major relationships should be experimentally validated. Even when an unvalidated network is included in a paper, it should be explicitly identified as a working hypothesis rather than a result.
Unvalidated Networks Can Accumulate as Scientific Knowledge
The impact of publishing an unvalidated network diagram does not end with the paper in which it appears. Relationships described in a paper may be cited by subsequent studies and incorporated into knowledge bases, thereby influencing the subsequent development of scientific knowledge.
Relationships described in previous papers are registered in knowledge bases, and those knowledge bases are then used to generate new network diagrams. When a description of such a network is included in a new paper, that paper becomes another source that can be cited by subsequent studies. If this process is repeated, relationships that were originally observed only under limited conditions, or relationships that were presented merely as hypotheses, may begin to appear repeatedly in multiple publications. Even when the same information has merely moved from a knowledge base to a paper, and then from that paper to another knowledge base or network, it may appear to be a relationship supported by multiple independent studies.
Furthermore, when information from papers and databases is incorporated into knowledge graphs or AI-based literature analysis, the relationship may be used in answers and interpretations as though it were an established biological mechanism. In this way, network analysis does more than summarize existing knowledge. It can also become a pathway through which unvalidated hypotheses enter the next generation of scientific knowledge.
Do Not Read the Lines in a Network Diagram as Experimental Evidence
When reading a network diagram published in a previous study, it is also important not to treat its lines as experimental evidence at face value.
Network diagrams are useful for organizing complex information and planning the next experiment. However, having many lines or a centrally positioned node does not mean that the relationships are supported by a large body of experimental evidence, nor does it mean that the node is a hub in the actual regulatory network. When reading a network diagram, at least the following questions should be considered.
- Was the line derived from experimental data generated in this study?
- Does it represent expression correlation, a change after knockdown, or physical binding?
- Does it represent a direct relationship, or could it reflect an indirect response?
- Was the relationship reproduced using another measurement method or under another experimental condition?
- Was it added from a knowledge base without being validated in this study?
If each line in a network diagram cannot be traced back to the original experimental data or the publication supporting it, the diagram cannot be treated as evidence of a biological mechanism.
Summary | If a Network Is Included in a Paper, It Should Be Validated
Network analysis is not an essential component of RNA-Seq analysis. If RNA-Seq is used to identify candidates and those candidates are functionally validated, those results alone can stand on their own as a complete study.
Knowledge-based tools such as IPA are useful for identifying relationships that should be tested next. However, a network generated by such a tool is not a mechanism that has been confirmed in the study.
If a network diagram is included in a paper and used to discuss a biological mechanism, the major nodes and edges must be experimentally validated. An unvalidated network is not a result. It is a working hypothesis.
If it is used only for hypothesis generation, it can remain an internal working document. If it is included in a paper, its major relationships should be validated. To present a network diagram as scientific knowledge, researchers must be able to explain what each line represents and which experimental evidence supports it.
Related Topics
- Using ChIP-Atlas to Interpret RNA-Seq Results: TF Binding Peaks and Upstream Regulator Candidates
- A Quick Tutorial on Integrating ChIP-Seq and Gene Expression Microarray Data Sets
- Bulk RNA-Seq Data Analysis Tutorial: Learn the Workflow and How to Interpret Results
- GO and Pathway Analysis Will Become Outdated - The Era of Interpreting Data Together with AI
