In a previous article, we used a public RNA-Seq dataset to carry out a standard RNA-Seq workflow in Galaxy. What we found was that even when reliable analysis tools are combined and a standard workflow is completed successfully, that alone does not tell us whether the resulting conclusions can be trusted.
This time, as a follow-up, we analyzed the same dataset using RaNA-Seq . Starting from FASTQ files, RaNA-Seq can perform Quantification, Quality Control, Differential Expression, Functional Enrichment, and GSEA through a web browser. One of its main advantages is that it can generate a complete set of analysis results quickly without requiring coding. Even today, in 2026, RaNA-Seq still appears near the top of Google search results for terms such as “RNA-Seq analysis tool.” However, when a tool automates even more of the analysis than Galaxy, it becomes more difficult to see exactly what was done, raising a more fundamental question: can the reliability of the resulting analysis still be adequately evaluated? In this article, we examine that question in practice.
We again use the GSE173789 dataset. In an earlier case study, we found that this dataset contains expression variation strongly suspected to have been caused by factors unrelated to the original biological comparison . Before continuing, we recommend first reviewing that case study or watching the Short Analysis 1 video below to understand the characteristics of this dataset.
Short Instruction 1: Detecting Potential Outliers with PCA and Confirming Them with Multiple Visualizations
RaNA-Seq can automatically perform a complete analysis starting from FASTQ files
In RaNA-Seq, once FASTQ files are provided and the sample groups to be compared are defined, commonly used RNA-Seq analysis tools are run automatically. Once the data have been imported, the remaining workflow is extremely simple, and the analysis results can be obtained surprisingly quickly. The figures shown in the web reports are visually polished, and the PDF reports are also presented in a clean format similar to figures commonly seen in scientific papers. The main reports and result files obtained from RaNA-Seq in this analysis can be downloaded here for direct inspection.
In other words, RaNA-Seq is very well designed if the goal is to run an analysis with minimal effort and quickly obtain something that looks like a finished result. However, the question we want to examine here is whether the reliability of those results can actually be evaluated.
An unexpected problem occurred before the analysis even started
RaNA-Seq allows local FASTQ.gz files to be uploaded by dragging and dropping them into the browser. It also provides a function for retrieving public RNA-Seq data by specifying an ENA Study Accession. Both methods are demonstrated in an introductory video published in 2021. However, neither method worked successfully in our environment. Uploading local FASTQ files resulted in an error partway through the process, and specifying an ENA accession also resulted in an error after processing had started. Problems like this can occur with web-based tools, but the difficulty here was that no useful information was displayed to help identify or resolve the problem.
We therefore inspected the implementation using the browser's developer tools. The files were divided into chunks of approximately 2 MB, and each chunk had a 10-second timeout. Within the code we examined, we also could not find an automatic retry mechanism for chunks that timed out. In other words, when uploading a large FASTQ file consisting of many consecutive chunks, a single chunk taking longer than 10 seconds can cause the entire file to fail. Under these conditions, successfully uploading gigabyte-scale FASTQ files can be quite difficult. No explanation of this limitation is provided in the user interface.
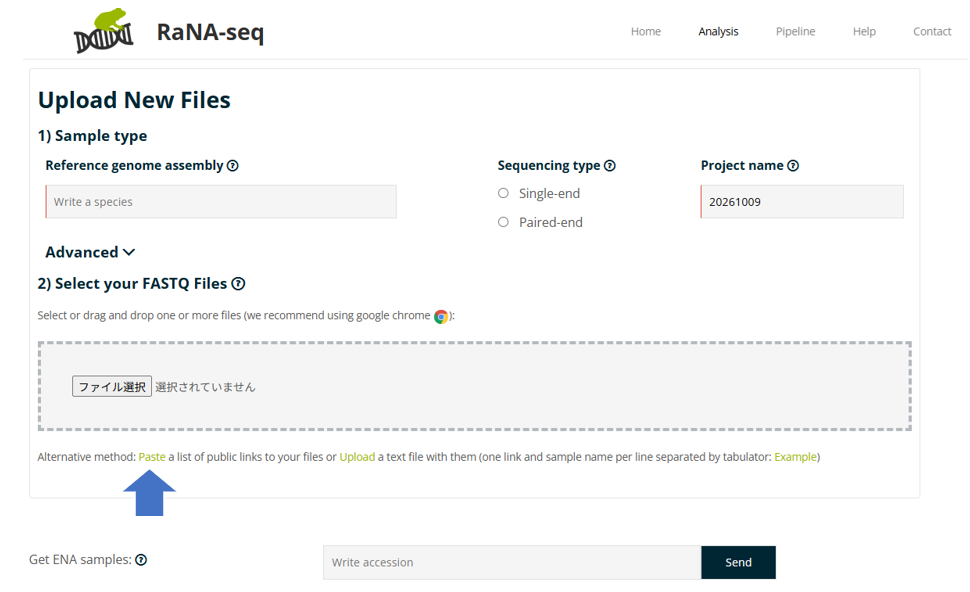
What finally worked was the inconspicuous “Paste” option
The method that ultimately worked was to specify the FASTQ file URLs directly. In the current RaNA-Seq interface, an Alternative method section appears near the bottom of the Upload New Files screen, with a small Paste link. When direct URLs to FASTQ.gz files hosted by ENA were entered there, RaNA-Seq retrieved the files successfully and proceeded to quantification.
What is particularly notable is how fast file import is with this method. When the required conditions are met, RaNA-Seq is a very attractive option for converting FASTQ files into Gene Counts .
The QC report contains the expected plots, but it is difficult to go further
The Quality Control report contains a Box Plot of expression values, the number of expressed genes, a sample similarity Heatmap, and PCA. In other words, the standard types of plots commonly used for QC are all present. However, there is very little explanation of what should be checked, what kinds of patterns should raise concern, or what should be investigated next when a suspicious structure is observed. The User Manual does provide some explanation, and experienced analysts can extract a reasonable amount of information from these plots. However, it may be difficult to expect the same from users who come to RaNA-Seq specifically because they expect RNA-Seq analysis to be easy without coding. As a result, there is a risk that QC becomes a step for producing figures showing that an analysis was performed rather than a step for actually evaluating the reliability of the results.
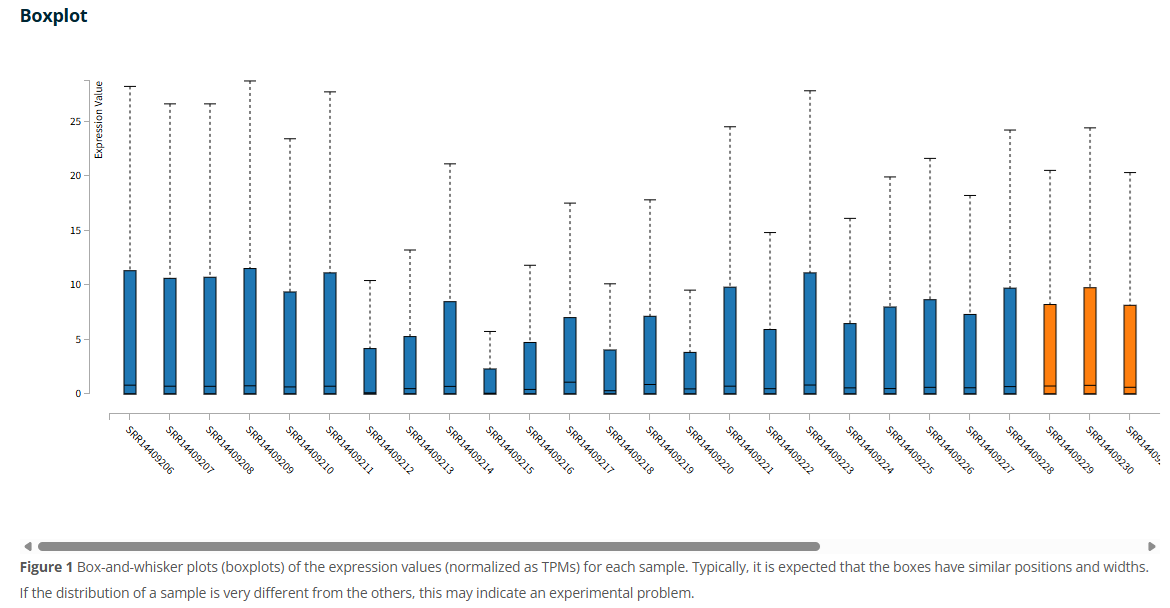
expression values (normalized as TPMs), but judging from the range and distribution of the displayed values, they do not appear to represent TPM values directly. One possibility is that the values are log-transformed Gene Counts, but we could not determine exactly what is being displayed.
In the PCA obtained here, PC1 alone explains 94.47% of the variance, and several samples are clearly separated from the others. With only one exception, those separated samples belong to the multiple sclerosis (MS) group. If this figure is viewed with the expectation that the experiment should reveal a disease-related difference, it would be easy to interpret the result as successfully capturing a difference in expression profiles between the groups.
However, on the left side of the plot there is a cluster containing nearly equal numbers of MS and Healthy Control samples. An experienced analyst might therefore pause and ask, “What is actually driving PC1?” As described above, this dataset contains expression variation strongly suspected to have been caused by factors unrelated to the original biological comparison. The problem is that even when such a question arises, RaNA-Seq provides little means to investigate it further. To determine whether this structure is associated with experimental conditions, sample characteristics, expression distributions, library quality, or technical factors, the data must be taken into another analysis environment.
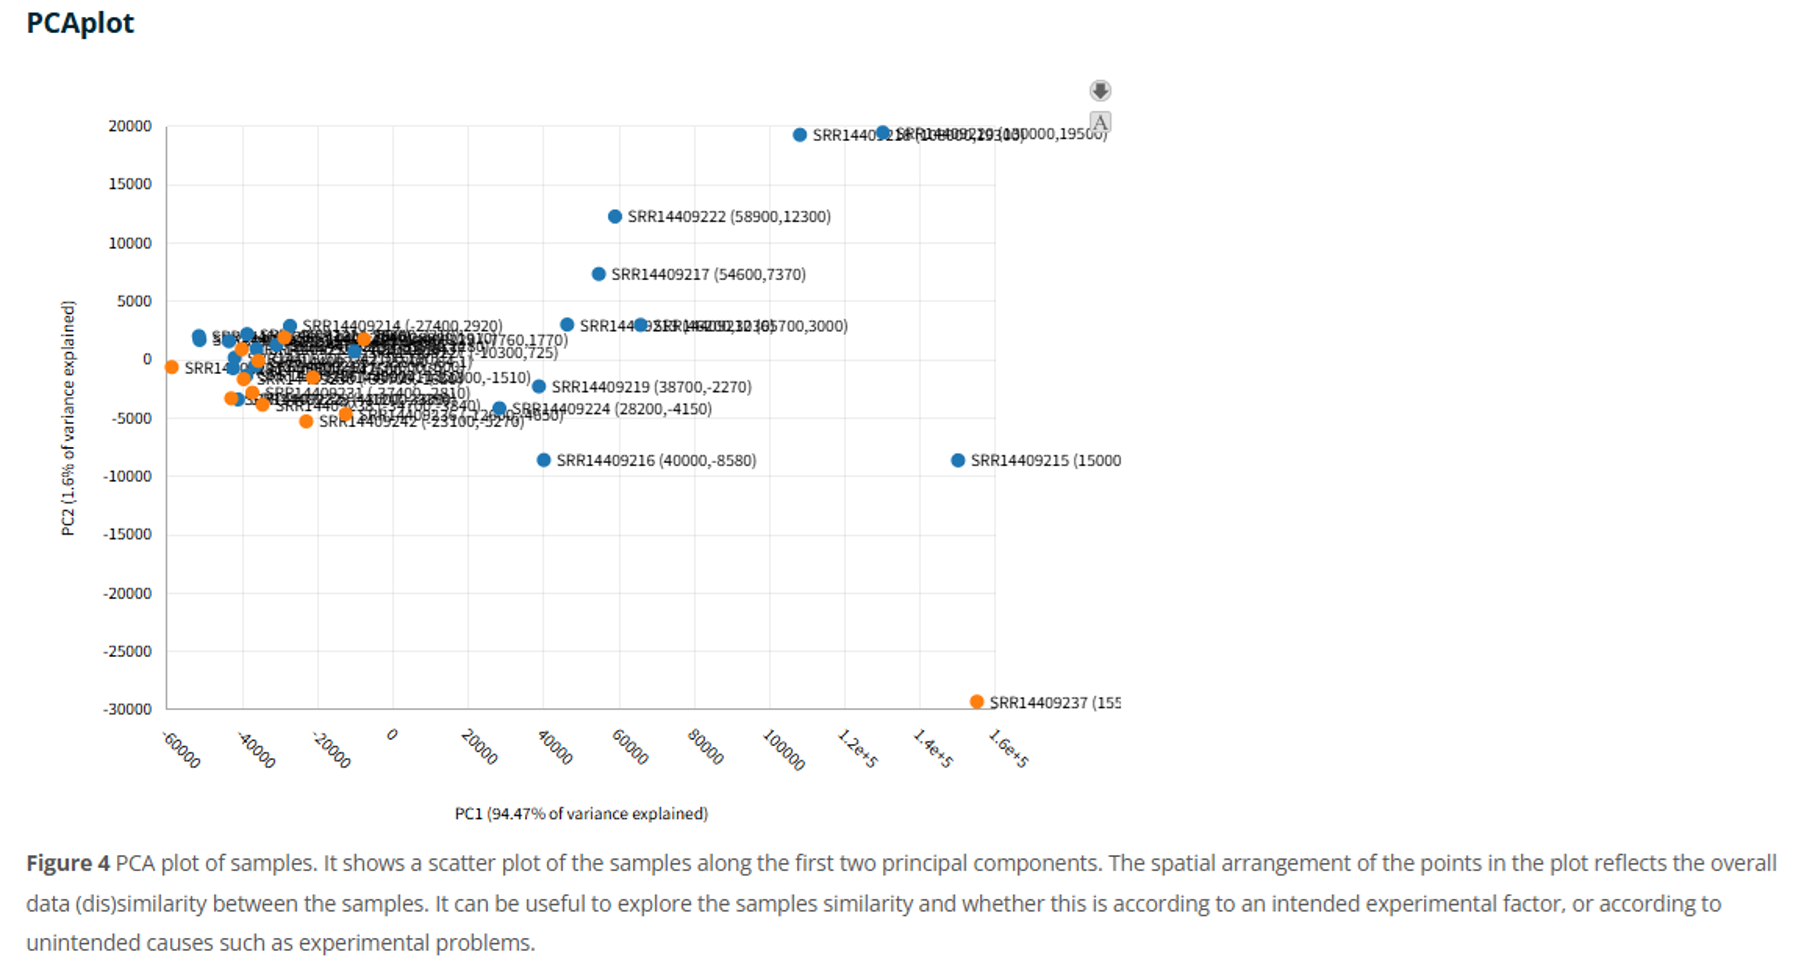
In addition, identifying what a suspicious sample actually represents requires tracing the SRR number back to the corresponding GSM number and then checking the associated sample metadata. The PDF report adds another layer of cross-referencing: on the first page, the samples are assigned new numbers from 1 to 36, and those numbers are then used in the subsequent Heatmap and PCA figures.
In other words, RaNA-Seq can show us that “there is a major structure in the data.” However, it does not provide enough information to determine whether that structure should be trusted or questioned. In this case, we know to question it because we had already identified distortions in this dataset through other analyses.
This issue also arose in our evaluation of Galaxy. “You can see that something may be wrong, but it is difficult to investigate why.” That problem is common to both tools. However, Galaxy allows you to return to the output of each step and add other visualizations or analyses. In RaNA-Seq, the workflow is more tightly automated, so once you notice a suspicious pattern, there is even less flexibility to investigate what is causing it. To some extent, this is an expected consequence of this type of automated analysis tool.
However, we also found another difficulty that goes beyond this expected limitation.
The DE report does not make it clear how some of the results were produced
The Volcano plot obtained in this analysis has a somewhat different shape from the Volcano plots commonly seen in RNA-Seq studies. When analysts encounter a plot like this, they would normally ask why it has this shape and investigate the cause. RaNA-Seq, however, does not provide tools for that kind of exploration.
The MA plot raises another question. In the low-expression region, the log2 fold changes are strongly concentrated around zero. This appears to indicate some form of processing applied to low-expression values or some procedure that reduces the magnitude of variation. However, neither the report nor the User Manual provides enough information to identify the specific processing responsible for this characteristic distribution. The User Manual explains the general meaning of an MA plot, but it does not explain what processing causes the particular shape observed here.
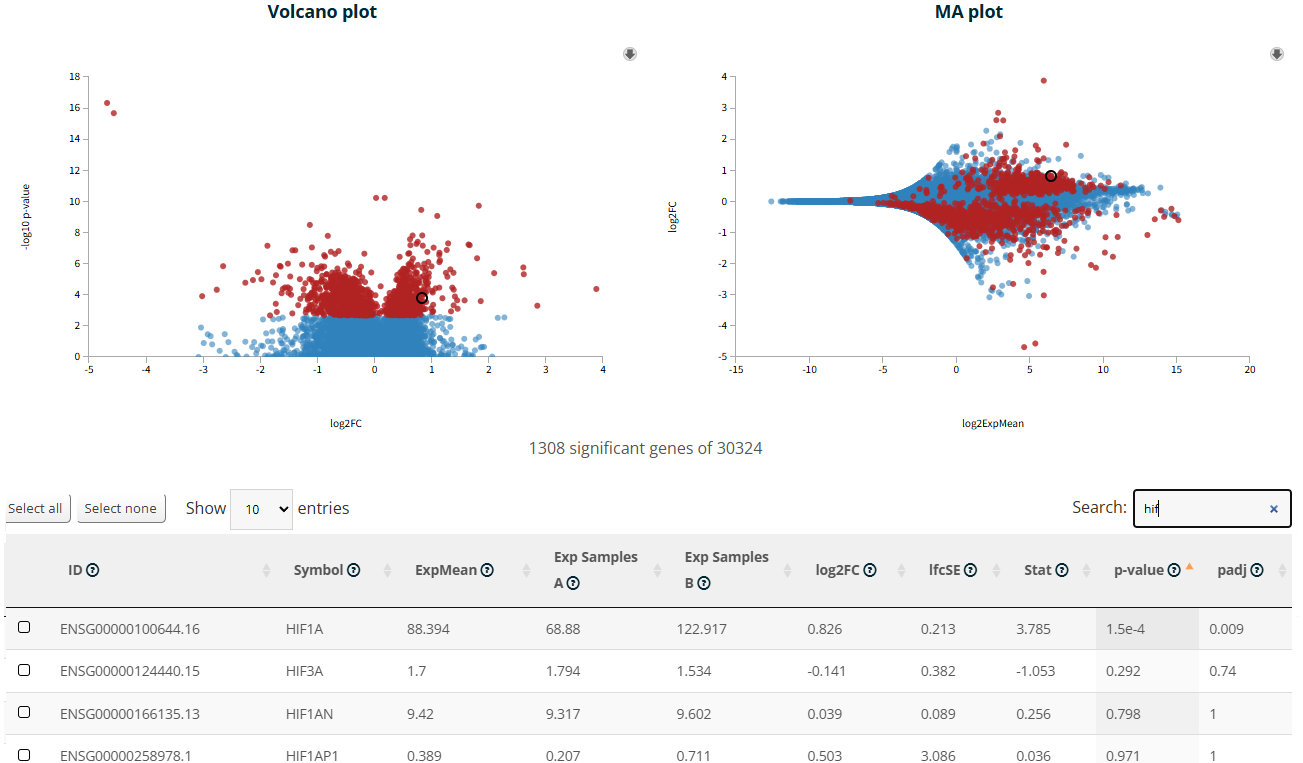
If these results were used in a paper and we were asked to explain the analysis method or the characteristics of the results, the analyst would be unable to provide a well-supported answer because neither the report nor the User Manual provides sufficient information about the processing that produced these results.
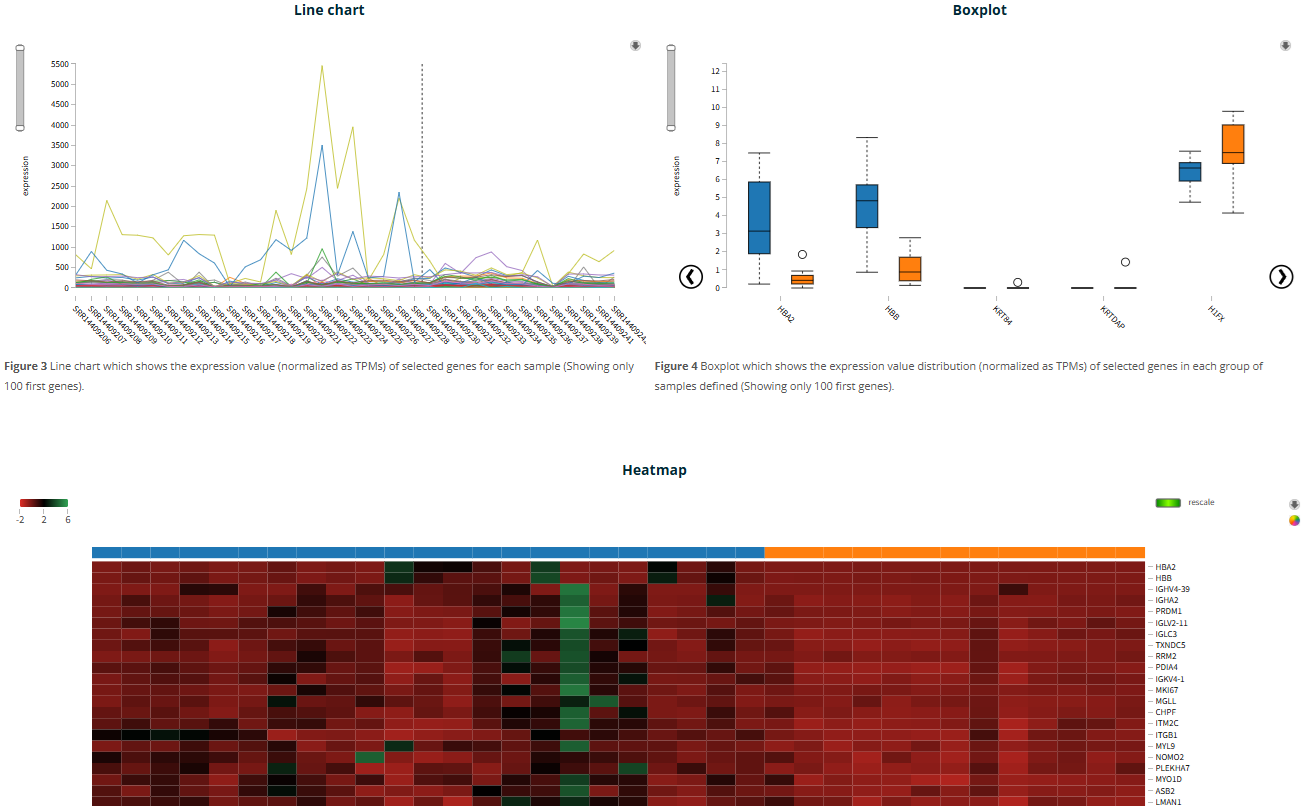
The Web version also includes visualizations that are not included in the PDF, such as a line graph, Box Plot, and Heatmap. According to the User Manual, the Line chart, Boxplot, and Heatmap all display expression value(s) (normalized as TPMs).
However, although the vertical axes of Figure 3 and Figure 4 are both labeled “expression,” their scales are completely different. In addition, Figures 3 and 4 contain no negative values, whereas Figure 5, the Heatmap, does. TPM itself cannot be negative, so at least the Heatmap must involve some additional transformation. Here again, the User Manual makes it possible to understand what each figure is intended to show, but it is not possible to determine exactly what transformation has been applied to the values displayed in each figure.
In Materials and Methods, you may have little choice but to write “RaNA-Seq was used”
When writing a paper, it is possible to state that “RaNA-Seq was used” for processing steps that cannot otherwise be explained, effectively delegating the methodological explanation to RaNA-Seq itself. However, that also means that there remain parts of the analysis that the analyst cannot fully explain in their own words.
Functional Enrichment strongly depends on the statistical selection of DEGs
In RaNA-Seq, genes that satisfy the p-value cutoff specified in the DE analysis are extracted as DEGs, and those genes are then used for Functional Enrichment. In this analysis, the p-value cutoff was 0.05. We could not find an option to combine this with a Fold Change cutoff when selecting DEGs.
This means that the set of genes passed to Functional Enrichment depends strongly on the statistical results of the DE analysis. Whether the p-value cutoff is set to 0.05 or to a more stringent value changes the number of input genes and, consequently, the GO and Pathway results. Despite the importance of this decision, only limited information is available for determining which p-value cutoff is appropriate for the dataset being analyzed. It is possible to rerun the analysis with different settings and compare the resulting number of DEGs as well as changes in the Volcano Plot and MA Plot. However, these are still summaries of the data. It is not possible to inspect individual samples and determine whether outliers or batch effects are distorting the results.
Statistical significance is certainly important, but before relying on it, we need to determine whether the statistical test itself was appropriate for the data. RaNA-Seq does allow some freedom to change the statistical method and certain settings, but the problem is that there are limited means to evaluate which settings are appropriate for the dataset at hand.
The GenesAnot column is genuinely useful
One feature of the Functional Enrichment Excel output that deserves clear praise is the inclusion of the GenesAnot column. This makes it possible to see exactly which genes are associated with each GO term or Pathway. If the same genes repeatedly appear across many significant terms, it becomes possible to examine whether the result reflects many independent biological phenomena or whether a limited set of genes is making many related terms significant at the same time. As discussed in “Can GO and Pathway Analysis Really Tell Us the Cause?,” the background knowledge used by both GO and Pathway analysis contains its own biases, so this type of validation is important for avoiding misleading interpretations.
Going further, returning to the expression patterns of those genes in individual samples allows hypotheses to be compared directly with the observed data. That step cannot be performed within RaNA-Seq itself, so another analysis or visualization environment is required. Nevertheless, the fact that RaNA-Seq exports enough information to trace the enrichment results back to the genes that produced them is highly valuable.
If you would like to see exactly what information is provided, download the files here and examine the GenesAnot column in GOSEQ_PathResults.xlsx or GOSEQ_GOResults.xlsx.
The Web visualizations are polished
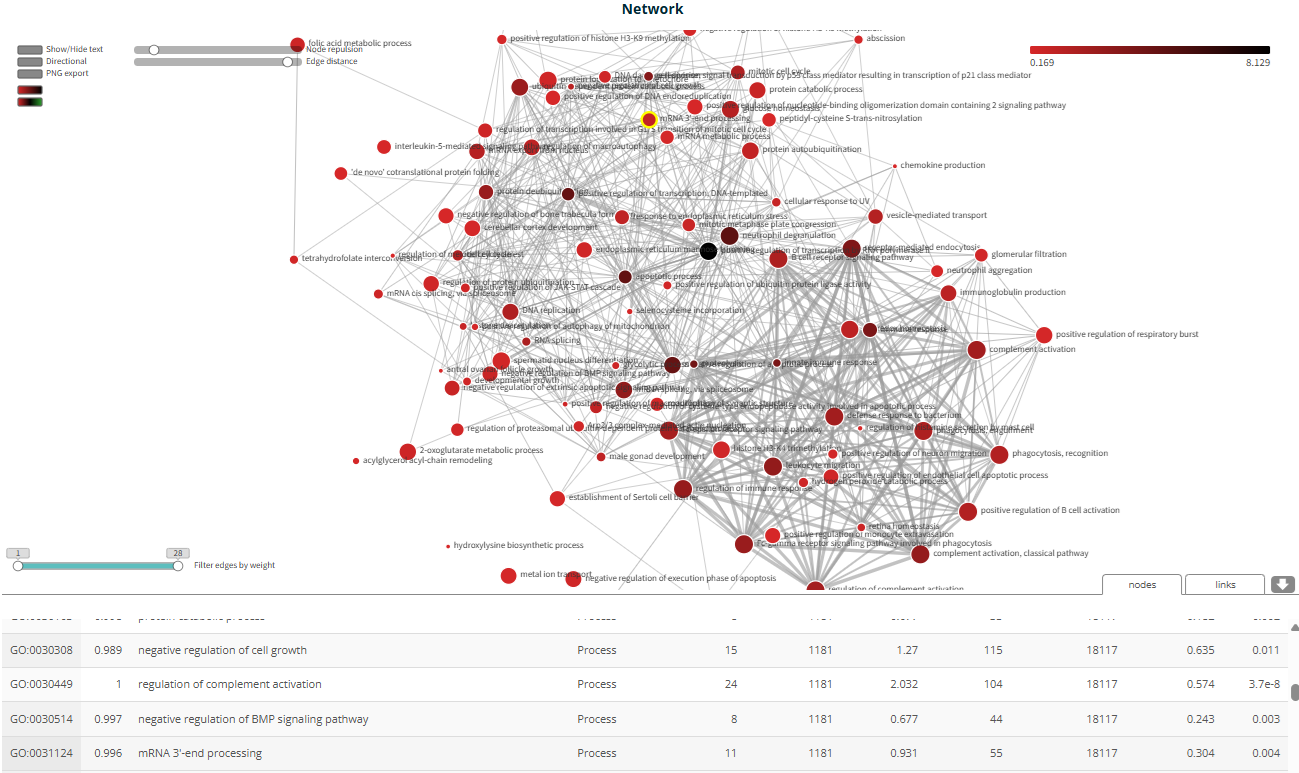
The RaNA-Seq Web report contains many visualizations that are not included in the PDF, including Bar plots, GO term networks, and Symmetric Heatmaps showing the number of genes shared among functional categories. In the network graph, node repulsion and edge distance can be adjusted with sliders, and the nodes are rearranged very smoothly. As an interactive visualization interface, it is quite attractive and visually polished.
However, a complex network figure that looks highly technical does not necessarily provide an answer to the biological question being studied. Network diagrams in which nodes and edges become densely tangled and difficult to read are often referred to in English as “hairballs,” and this analysis produced a particularly impressive example. These figures show the extent to which genes are shared among GO terms or Pathways. That information is not inherently meaningless, but when it comes to the biological question in this study, what exactly should we conclude from it? Extracting a meaningful biological interpretation from this figure is extremely difficult.
In that respect, the GenesAnot column in the Excel output described above is more useful for actual validation than the visually impressive network diagram. A visualization that looks impressive and information that helps validate an analysis are not necessarily the same thing.
GSEA results are produced, but understanding what they mean is not easy
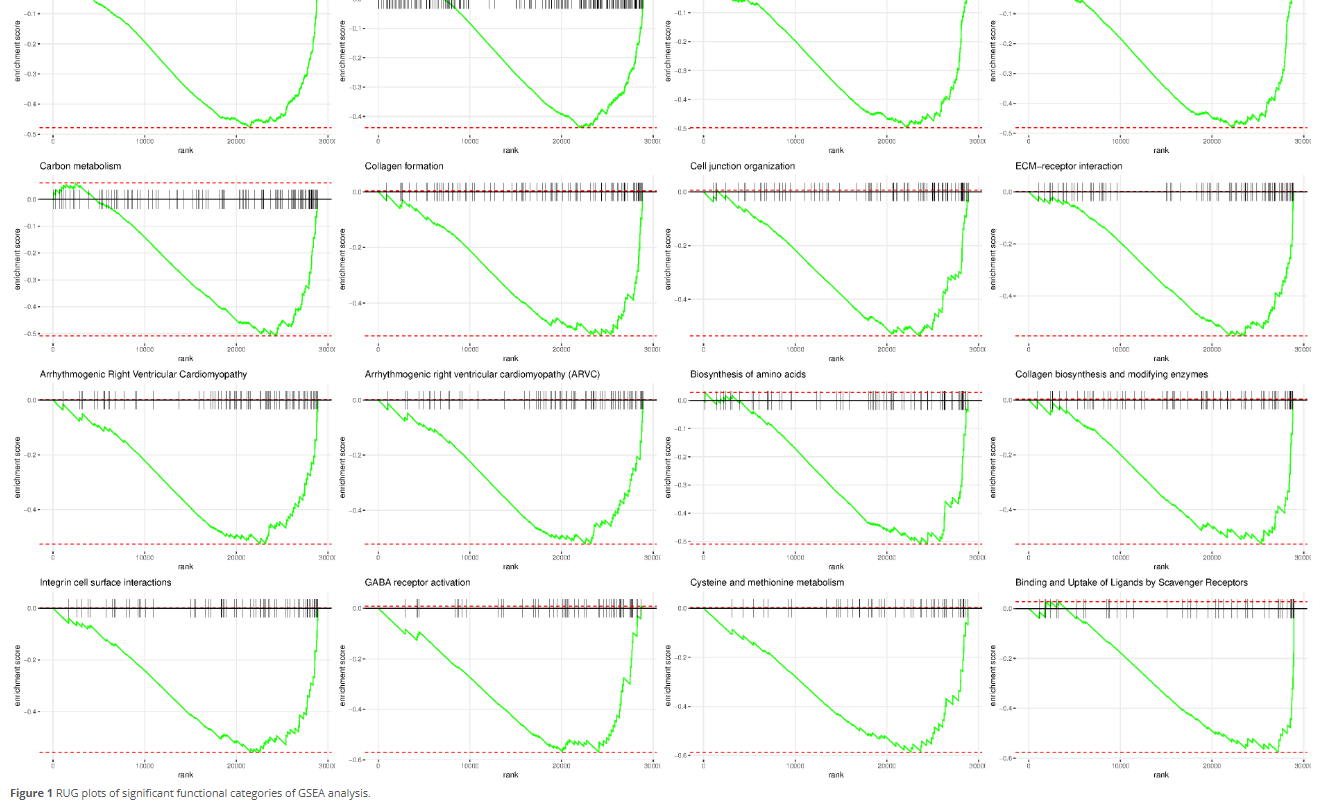
RaNA-Seq also automatically performs GSEA using fgsea and generates numerous RUG plots. The User Manual explains the general result items used in GSEA, but for users who are not already familiar with GSEA, understanding what these plots mean in the context of the actual experiment is not straightforward.
For example, when looking at the current results, one might wonder why some gene sets have very small P-values even though the genes belonging to the gene set do not appear to be clearly concentrated toward one side of the ranking. GSEA is not simply a method for counting how many genes appear on the upregulated side versus the downregulated side, so the meaning of the result cannot always be understood intuitively by looking at the plot alone. Likewise, simply examining the results in order of P-value or enrichment score does not automatically provide a biological interpretation. For each GeneSet identified by GSEA, the analyst must still determine whether it is meaningful in the context of the study. However, when many figures that look highly technical are produced automatically, there is a risk that the satisfaction of having obtained “figures that look suitable for a paper” comes before fully understanding and validating what those figures actually mean.
Another problem is the lack of analysis-specific explanation. Even after checking the User Manual, it is not clear what ranking metric was actually used in this analysis or which side of the ranking corresponds to Samples A and Samples B. The concept of leading-edge genes is explained, but to determine which condition a particular gene set is associated with in this comparison, we need to know how the rank itself was defined in this analysis. Therefore, there is not enough information to determine precisely what these plots mean in the context of this particular analysis.
RaNA-Seq may represent a particular era of analysis tools
At this point, our evaluation of RaNA-Seq may appear quite critical. However, it is important to consider the period in which RaNA-Seq was developed. Until only a few years ago, one of the major challenges in RNA-Seq analysis was simply being able to operate the analysis tools. You needed to know how to use the command line, write R code, run Salmon, run DESeq2, and perform GO analysis. Even getting all of these tools to run successfully required substantial knowledge and experience.
In that environment, RaNA-Seq offered something highly attractive: provide FASTQ files and obtain polished results very quickly without writing code. It is easy to understand why such a tool was welcomed. By hiding difficult operations and making RNA-Seq analysis accessible to more researchers, its design was highly reasonable for its time.
But AI has changed the premise
The situation is now changing. Even if you cannot write R or Python yourself, AI can help generate the code. Even if you do not know how to run DESeq2, AI can explain how to do it. More importantly, you can now ask questions such as: “Why should this filter be used?” “Why is this normalization necessary?” “Why does this MA plot have this shape?” “Which contrast should be used for this experiment?” or “What should be written in the Methods section?” AI answers are not always correct, of course, but the era in which simply being able to operate an analysis tool was enough is clearly coming to an end.
As a result, the criteria by which automated analysis tools should be evaluated are also changing. In the past, the important question was “How much can the tool automate?” Today, a more important question is how well humans can understand the automated processing, evaluate whether the methods and results are appropriate, change the conditions when necessary, rerun the analysis, and compare the resulting outcomes.
The simplicity of operation that was once a major advantage—and the rigid automation that often came with it—may become less attractive than it once was.
AI can allow analysts to return to their real role
This does not mean that AI will take the analyst's job. In fact, the opposite may be true.
If AI reduces the burden of operating analysis tools, analysts can spend more of their time deciding what should be investigated, examining the state of the data, judging whether an analysis method is appropriate, questioning the results, returning to the underlying data, rerunning analyses under different conditions, and comparing different outcomes.
These are the tasks analysts should have been responsible for all along.
Before AI, automated analysis tools simplified analysis by hiding difficult operations. Now that AI can assist with operating the tools themselves, there is much less reason to hide the processing as well. Instead, it becomes more important to be able to see what was done, think about why a particular result was obtained, and return to the underlying data to investigate any questions that arise.
AI may finally allow analysts to move beyond being “people who operate tools” and return to their real role: looking at the data, thinking, questioning, and making judgments.
The analyst's job is not simply to produce results, but to understand and validate them.
Subio Platform is a place to see and verify results obtained with AI, R, and Python. Visualize your analysis results, compare them with the underlying data, and determine whether they are truly reasonable. Then share the results and use them as a basis for discussion. We believe this kind of analysis environment is becoming even more important in the age of AI.
Learn more about Subio Platform
If you would like help determining how to analyze your own data or interpret your results, we also offer an RNA-Seq Data Analysis Service.