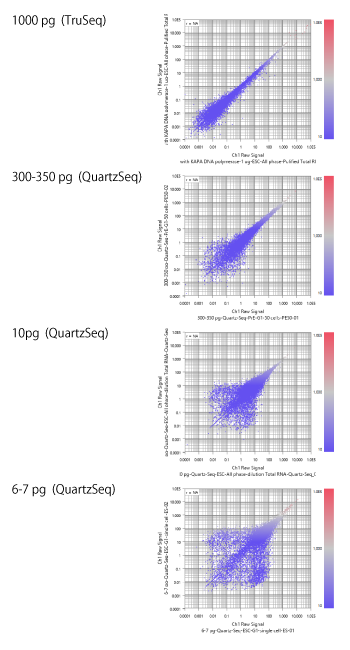
GSE42268 is a data set containing samples of various input RNA quantity. So it is a good example to see the effect of the input quantity over the RNA-Seq data quality.
The top chart is the result from 1ug total RNA samples. The value is FPKM, not count. So the boundary between the noise and signal area looks unclear. But still you can see that the boundary lays between 0.1 and 1. Maybe you can say like "if the value is larger than 0.5, you can trust the measurement."
The second one, the input is 300 - 350 pg (about 1/3). In this chart, the boundary seems to lay between 1 and 10. Maybe you can trust the measurement, if it is larger than 5.
The third, the input RNA is 10pg. You see that the area under 10 looks like random noise. And the cloud of plots under 50 is pretty broad. So maybe you can take values larger than 50 though, the precise signals are more than 100.
The last chart is of 6 - 7pg input RNA. Values less than 100 looks noise. And only a small part of genes have the highly trustful measurements, larger than 1000.
The lessons from this data set are:
- The smaller input RNA results in the narrower dynamic range. You can get fewer genes with the trustful measurements.
- Different input quantities and protocol generates different data distribution patterns. So you cannot say like "FPKM values larger than 10 are reliable." over the data set.