Using a dataset that appears to contain expression changes caused by factors unrelated to the original research question, we examined in detail whether such distortions could be detected when the data were analyzed with Galaxy or RaNA-Seq .
We found that looking only at variation in total mapped/assigned reads, box plots of Gene Counts for each sample, or PCA plots in a report may suggest that something is unusual, but it is still difficult to determine whether those samples should actually be excluded. Making that judgment requires an environment in which multiple types of information can be examined together. Simply running the appropriate tools in a pipeline does not, by itself, confirm the validity or reliability of the resulting analysis.
In this article, we focus on another issue that emerged during those comparisons: what to consider when using Ensembl Gene ID-based Gene Counts for downstream gene-level analysis.
Why was the distortion harder to see in RaNA-Seq?
For the Gene Counts provided by GEO and those calculated with HISAT2 + featureCounts in Galaxy, centering each gene and displaying its expression as a Log2 Ratio relative to the mean makes the sample-specific distortion we have been following clearly visible. However, when the Gene Counts obtained from RaNA-Seq were displayed in the same way, the overall variability was much greater, making the same distortion harder to distinguish from the surrounding variation.
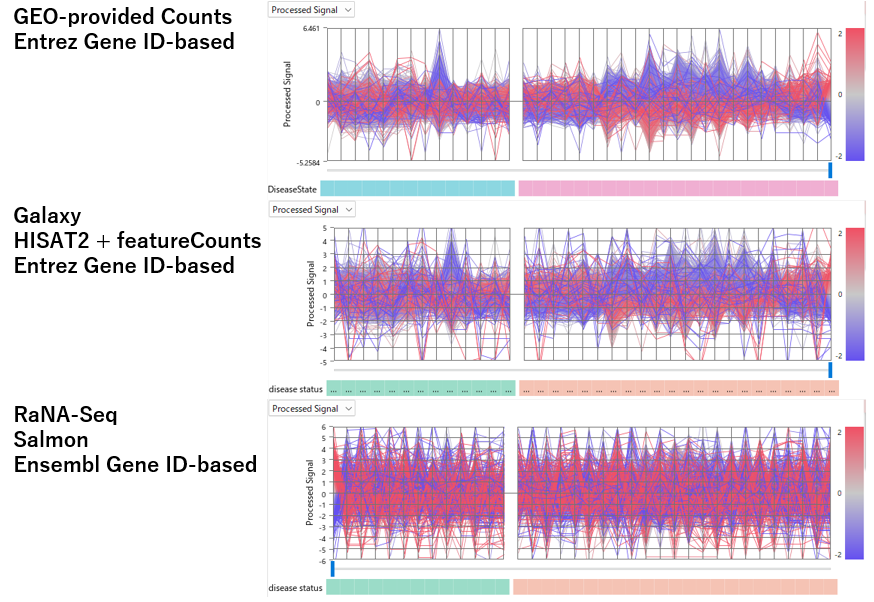
The Gene Counts provided by GEO and those calculated in Galaxy are based on Entrez Gene IDs, whereas the Gene Counts from RaNA-Seq are based on Ensembl Gene IDs. We therefore examined the RaNA-Seq output more closely.
Multiple Ensembl Gene IDs can correspond to the same Gene Symbol
In the RaNA-Seq Gene Counts, we found many cases in which multiple Ensembl Gene IDs corresponded to the same Gene Symbol. For example, RPS9 appeared in multiple rows, each with a different Ensembl Gene ID but the same RPS9 Gene Symbol. More importantly, the proportion of Counts assigned to each ID was not constant across samples. In some samples, one ENSG ID received more Counts, whereas in others, a different ENSG ID received more. However, when the Counts for all of these IDs were summed as RPS9, the total was around 20,000 in many samples.
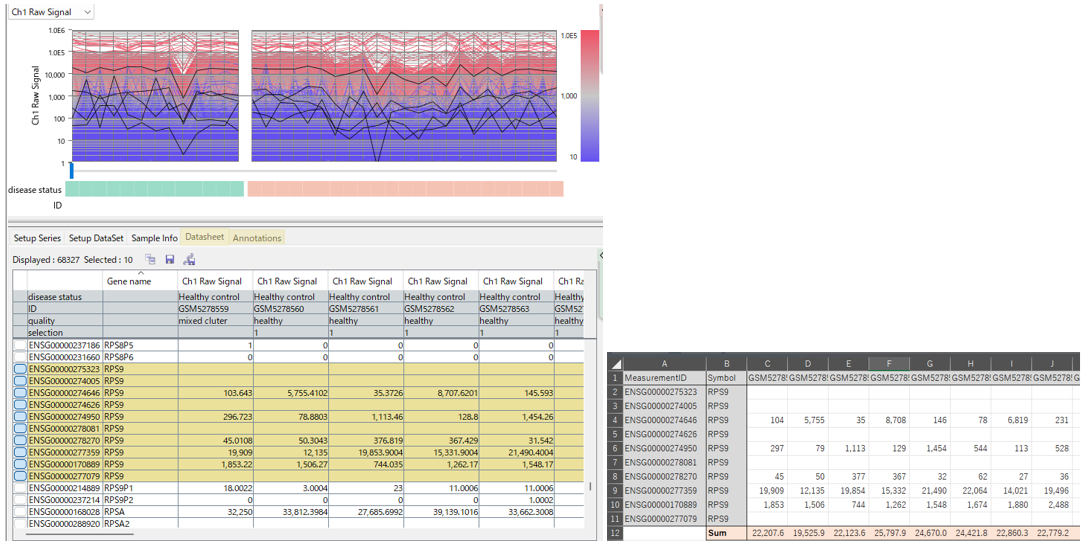
In other words, in this dataset, the total expression of RPS9 itself does not appear to vary dramatically; rather, the distribution of Counts among the multiple Ensembl Gene IDs corresponding to RPS9 changes from sample to sample. If each Ensembl Gene ID is treated as an independent gene, the individual IDs may therefore appear to show large sample-to-sample variation even when the overall gene-level expression is relatively stable.
We suspected that this was one reason why the RaNA-Seq Gene Counts appeared to show much greater overall variability when viewed at the Ensembl Gene ID level.
Importing the data after summing by Gene Symbol
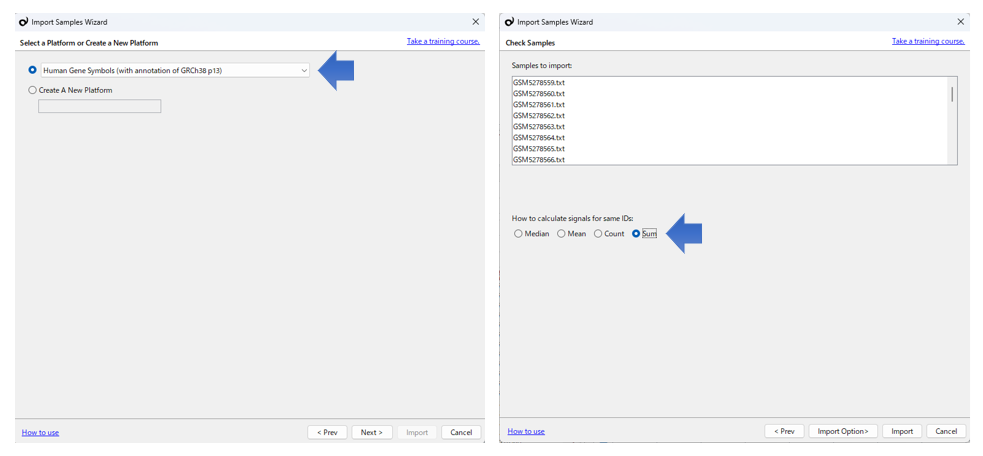
Because our goal was gene-level analysis, we decided to sum the Counts for Ensembl Gene IDs that corresponded to the same Gene Symbol within each sample.
In Subio Platform, select a Gene Symbol-based Platform rather than an Ensembl Gene ID-based Platform in the Sample Import Wizard. Then, under How to calculate signals for same IDs, select Sum. This causes multiple rows with the same Gene Symbol to be summed within each sample and imported as Gene Symbol-level Gene Counts.
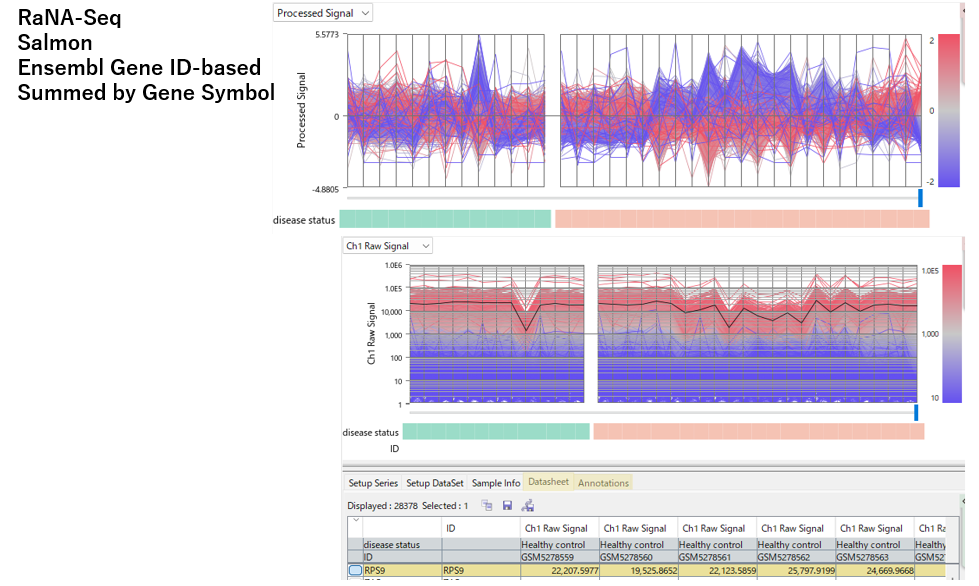
RPS9 is then displayed as a single RPS9 entry rather than as multiple ENSG IDs, and the value for each sample matches the total calculated in Excel above. When the entire dataset is visualized again in this form, the sample-specific distortion that had been obscured by other variation at the Ensembl Gene ID level becomes clearly visible.
In other words, the distortion had not disappeared from the RaNA-Seq Gene Counts. Instead, viewing the data at the Ensembl Gene ID level introduced additional variation arising from the distribution of Counts among multiple IDs corresponding to the same Gene Symbol, making the gene-level structure harder to see.
Sum ENSG ID-Based Counts by Gene Symbol Before Gene-Level Analysis
The phenomenon described here was observed in GSE173789, and the same degree of difference will not necessarily occur in every RNA-Seq dataset. However, the practical rule that follows from this observation is straightforward.
If you are performing downstream gene-level analysis such as PCA, clustering, DEG analysis, or heatmap visualization, we recommend summing ENSG ID-based Gene Counts for IDs that correspond to the same Gene Symbol before proceeding with the analysis.
The fact that a table is labeled “Gene Counts” does not mean that every Counts table has been aggregated at exactly the same biological level. For downstream gene-level expression analysis, using values summed at the Gene Symbol level can improve the validity and reliability of the analysis.
Generating a result is one thing. Investigating what looks wrong is another.
The processing performed here can also be reproduced in Galaxy. However, the practical question during analysis is not simply whether something can be done. It is whether you can notice something unusual in the first place, and whether you can investigate it without introducing a large amount of additional work.
We did not begin this analysis by deciding in advance to sum the data by Gene Symbol. It started with a simple question after visualizing the RaNA-Seq results: Why can we see this structure in Galaxy, but not here? From there, we examined individual genes, noticed that multiple Ensembl Gene IDs could correspond to the same Gene Symbol, looked at specific examples such as RPS9, and then asked what would happen if those values were summed.
Again, the important difference is how easily you can notice the question and how easily you can test it.
Galaxy provides a large collection of tools for RNA-Seq analysis. R and Python allow you to build even more flexible analysis pipelines. Subio Platform, on the other hand, is not designed to provide a large collection of analysis algorithms. Its emphasis is on making results easy to visualize, helping you notice inconsistencies, and making it easier to investigate their causes.
These tools are therefore complementary rather than competitive. You can generate results with Galaxy, R, Python, or AI, and then examine and validate those results in Subio Platform. If necessary, you can revise the analysis method and compare the new results again. This back-and-forth process is important for understanding the data and for maintaining the validity and reliability of the analysis.
Visualize and validate your results
In RNA-Seq analysis, automatically generating results has become much easier than it used to be. With AI, even writing R or Python code is no longer particularly difficult. But generating a result is not the same as understanding it.
Whatever tool you use to generate the result, you can visualize it, examine it from another perspective, and, when necessary, change the analysis method and check it again. You can then share the result with other researchers and discuss what it means. Subio Platform is designed to support that process.