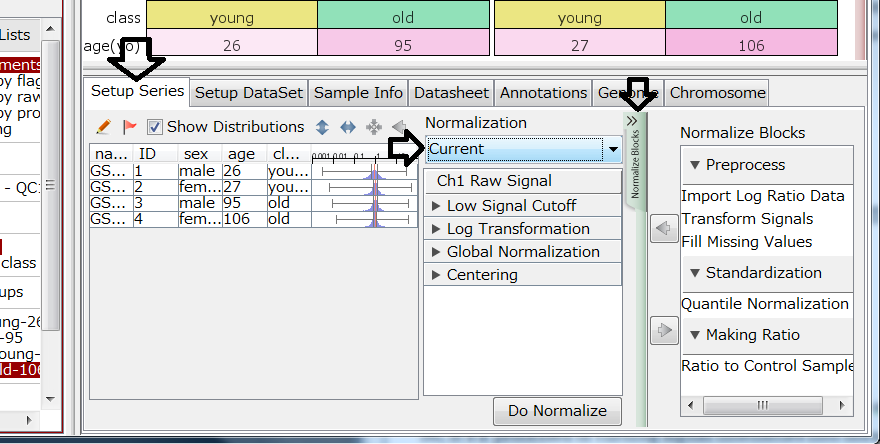
Ch1RawSignals are values you imported into Subio Platform. If it's dual channel (2 color) data, you see Ch2RawSignals, too.
"Processed Signals" are generated by normalization procedure in "Setup Series" tab. In "Normalization" panel, the top block is always Ch1RawSignals. And following blocks change values. You can see how the block change in box plot or histogram at left. And the last block completes the procedure and generate "Processed Signals", if you click on "Do Normalize" button.
You can safely try editing normalize blocks, only if you don't click "Do Normalize" button. If you're confused in editing blocks, select "Current" to recover to the normalization procedure currently applied. And clicking "Do Normalize" button overwrites the Processed Signals.
In conclusion, Processed Signals could be Log Ratio against average expression levels over the samples, if "centering" block is applied at the end. Or they could be log ratio against the control sample(s), if "Ratio to Control Samples" block is applied at the bottom.

Basically you don't analyze gene expression data based on Processed Signals instead of Raw Signals.
Why do you turn signals into ratios?

Because omics data is highly complex, you need to simplify data by ignoring expression levels, and focusing on only changes.
Notice that ratios are completely same regardless of their expression levels, if they're proportional. “Centering” and “Ratio to Control” have equivalent effect in this sense. The only difference is denominator. If you apply “centering,” it isn’t so important if ratio is higher (or lower) than 0. But if you apply “Ratio to Control,” ratios mean it’s more (or less) expressing than control.
But turning into ratio is only an expedient to reduce a dimension. After you extract genes showing a particular expression patterns, it's a good idea to recover the dimension because expression levels must have significant meaning in a biological context. For example, you can separate genes which are not expressed in the control from the vague "up-regulated" list. It can be more important than p-values.
Why do you turn data into log ratios, not simple ratios?

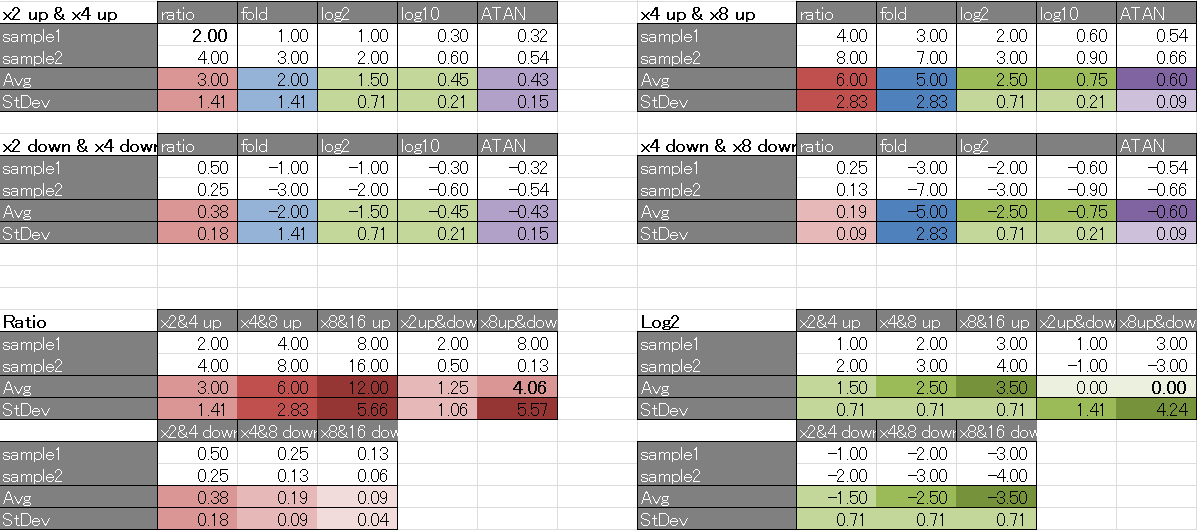
Ratios (red) are not balanced between up- and down- regulation. Up-regulation can be large number like 100 or 1000. On the other hand, down-regulation is expressed like 0.01 or 0.001. The distance from ratio 1, meaning "no change," can't be larger than 1. Don't you feel something wrong if I say the average of "8-fold up" and "8-fold down" is "4.06-fold up"?
There are several techniques to turn ratios to be balanced (blue, green and purple). Notice that all of them treat equally up and down regulations. You get answer "no-change" as the average of "8-fold up" and "8-fold down." It fits our common sense. The differences are increment and variance.
Logarithm is very well known and widely used technique. You don't need to care about base, 2 or 10. Log2 and log10 values are proportional. It makes no difference in results of statistical tests or clustering.
Why do you apply normalization?
Now you know why you turn signal intensities into log ratios. One more step is generally applied in preprocessing before you analyze gene expression data. It's normalization.

You often see systematic biases due to experimental factors like hybridization, wash or chemical regent among samples. You can simulate such bias on the Excel sheet. If you set 3, sample 2 is 3 times higher than sample1, and sample3 is 3 times lower globally.
Step1: Log2 Transformation: You see systematic bias, high in 2nd and low in 3rd.
Step2: Global Normalization: Cancelling bias features genuine fluctuations.
Step3: Turning into Ratio: It’s more obvious what genes are up- or down- regulated.
So, it's a processed of turning signal intensities into normalized log ratio. Look at the normalization scenario. There are often "Log Transformation," "Global Normalization" and "Centering" or "Ratio to Control" blocks.
But normalization is not always good. If you're comparing different cell types or different developmental stages, you can't expect that whole expression levels are same. In such cases, you need to consider if you apply normalization or not. Lean more on the article Why Subio Platform?
Download the Excel sheet to closely look the formula.
- The process of normalization is simple, and you can reproduce on Excel . It's worth understanding concepts of each step by tracing functions on it.